


Research on physical performance in female wheelchair basketball (WB) players is scarce, and evidence comparing male and female elite players remains limited. The aim of this study was to compare physical performance test between male and female Spanish national WB team players competing at the European Championship medal level.
Materials and methodsA total of 22 players from the Spanish national WB team participated in the study (male [n = 12]; female [n = 10]). During preparation for the 2025 European Championship, players completed a physical performance test including a rotator cuff test, Initial Maximum Push-Rim Propulsion (IMPRP), sprint tests (5 m and 12 m), and the Repeated Sprint Ability (RSA) test.
ResultsSignificant differences between male and female players were observed in maximal force and 1-s average maximal force during the rotator cuff test (p < 0.01; effect size [ES] >0.8), IMPRP test (p < 0.01; ES >0.8), 5 m and 12 m sprint test (p 〈0.01; ES 〉 0.8), and the RSA test (p < 0.01; ES >0.8), with high performance observed in male players.
ConclusionsMale WB players showed higher performance in selected physical performance test. This study provides reference performance data from European Championship medal-winning national-team WB players.
Wheelchair basketball (WB) is one of the most popular sports within the Paralympic programme and is characterized by an intermittent activity profile that combines high-intensity actions, short and intense bouts of sprinting, accelerations and decelerations, with long recovery periods.1 This pattern of effort requires WB players to maintain high levels of speed, agility, strength, power, and both aerobic and anaerobic endurance,2 together with optimal wheelchair-handling skills (propulsion, acceleration, deceleration and changes of direction), ball-handling skills (shooting, passing, dribbling or rebounding).3 and technical and tactical abilities to ensure effective match performance.4
To plan and monitor training and to determine athletes’ performance levels, regular assessment is essential.5 Furthermore, WB includes athletes with different types and degrees of physical impairment, which adds complexity to training design and performance evaluation.5,6
In this context, systematic assessment of physical fitness is key to monitoring and planning training, optimizing performance and reducing the risk of injury.2,5 Several studies highlight the need to standardize WB test batteries, combining specific field tests that include game-specific actions and skills with conditional assessments. Laboratory tests do not appear to be sufficient for coaches' assessments, who tend to prefer adapted field tests that incorporate sport-specific skills, propulsion techniques, and individual adaptations.5,7
Some studies have described the relationship between anthropometry, body composition and performance in field tests, as well as the influence of functional classification on technical-physical performance in WB players.2,5 Although these studies show that variables such as fat-free mass, size, and functional classification are associated with performance in sprinting, agility, and throwing, they do not directly address sex-based differences or include batteries of shoulder strength tests, initial propulsion tests, and repeated sprints assessments.2,5
Biological sex differences in upper body strength and muscle mass described in the non-disabled population suggest that male may perform better in upper limb strength and power tests, which could potentially translate into superior performance in sprints and explosive actions in WB.8 However, it remains unclear to what extent these differences manifest themselves in WB players competing at national and international level, or how they relate to performance in linear and repeated sprints, particularly when analyzing specific test batteries such as the rotator cuff test, Initial Maximum Push-Rim Propulsion (IMPRP), 12 m sprints and Repeat Sprint Ability (RSA) tests.5,9
Furthermore, most available evidence is derived from samples in which male and female players are analyzed together or from a game analysis perspective (statistics, shooting efficiency, performance according to functional classification), without conducting a systematic comparison of physical tests outcomes or examining potential correlations between physical fitness variables.6,9,10 This lack of information limits the ability to design training programs that are truly specific to female players and makes it difficult to establish sex-differentiated reference values for national- and international-level WB players. Baseline measurements indicate an athletes' strengths and weaknesses, while subsequent follow-ups enable monitoring of training effectiveness. In this regard, comparative assessments may help identify the most relevant skills for discriminating between performance levels of WB players, thereby supporting technical staff and players could benefit from specific training to better develop those skills.2,11
Female participation in WB has increased at both national and international levels. In many regions, due to the limited number of players, mixed teams are commonly formed in which female and male train and compete together.9 Unlike conventional basketball, physical abilities and performance in WB depend in complex ways on each athlete's residual functionality, making it difficult to assess differences attributed to sex.7,9,12 Therefore, there is a clear need to specifically examine sex-related differences in responses to physical performance tests in WB players competing at the national and international levels.
Accordingly, the aim of this research was to analyze the differences in physical performance test between male and female Spanish national WB players. Based on the physiological and anthropometric differences generally reported between males and females atheltes, we hypothesized that male players would demonstrate higher performance in the physical tests evaluated.
Material and methodsStudy designThis descriptive cross-sectional research was conducted during the training camp before the European Championship 2025. The training camps for male and female were held at different locations. Therefore, the research team was divided to conduct the data collection. The tests were conducted on an indoor pitch in the morning. The players were already familiar with the tests, so no familiarization period was required. Participants were reminded of the procedure for each physical test beforehand. No strenuous exercise was performed in the 48 h prior to the tests and were instructed to maintain their usual diet throughout the assessment period, as well as to avoid caffeine and alcohol on the day of testing and the day preceding. All assessments were performed using the competition wheelchair and the same type of competition court surface characteristics.
The order of the physical tests was: (i) rotator cuff test; (ii) IMPRP test; (iii) sprint test; and (iv) RSA test. At least 5 min of recovery were allowed between tests. Before starting the test battery, a standardized 20-minute pre-competition warm-up was performed, consisting of continuous pushing, joint mobility exercises, progressive submaximal accelerations, and constant changes of direction.
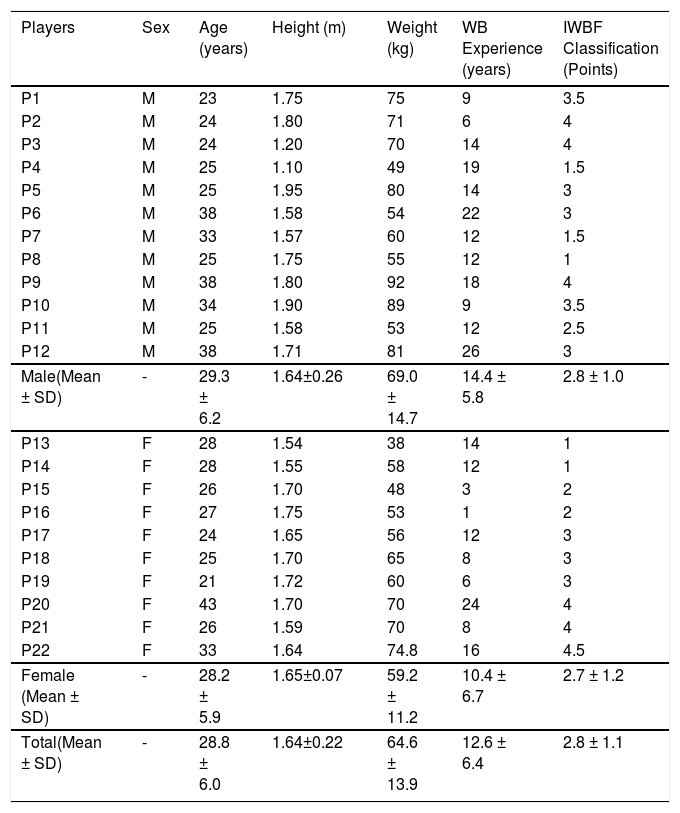
ParticipantsA total of 22 players from the Spanish WB national team participated in this study, comprising 12 male players (29.33±6.27 years; 1.64±0.26 m; 69.08±14.74 kg) and 10 female players (28.20±5.97 years; 1.65±0.07 m; 59.28±11.23 kg). The individual characteristics of the participants are presented in Table 1. All participants were members of the Spanish WB national teams during the preparation period for the 2025 European Championship, in which the male’s team won the gold medal and the female’s team won the bronze medal. Players were classified as elite/international-level athletes according to the Participant Classification Framework.13
Characteristics of male and female Spanish national team WB players.
M: male; F: female; IWBF: International Wheelchair Basketball Federation; WB: Wheelchair Basketball; SD: standard deviation.
All participants were verbally informed about the study and provided written informed consent after receiving detailed information regarding the procedures, as well as the potential risks and benefits. The study protocol was approved by the Research Ethics Committee of the Catalan Sports Council (015/CEICGC/2023) and was conducted in accordance with the Declaration of Helsinki. The inclusion criteria for participating in the research were: i) being a member of a sports federation; ii) having been selected for the national team; and iii) being able to perform the battery of physical tests independently.
Participants’ pathologies did not affect their upper limbs: amputation (n = 5), spina bifida (n = 1), familial spastic paraparesis (n = 2), spinal cord injury (n = 7), bilateral agenesis (n = 2), multiple arthrogryposis (n = 1), myelomeningocele (n = 1), infantile spinal muscular atrophy (n = 1), dysplasia (n = 1), and congenital malformation (n = 1). Participants were functionally classified according to the IWBF.14 The IWBF functional classification system categorizes players according to their functional ability to perform the fundamental movements required during WB, including trunk control, wheelchair propulsion, passing, shooting, and rebounding. The classification range extends from 1.0 (representing the player with the lowest level of physical function) to 4.5 (representing the player with the highest level of physical function).
Sample sizeIn this study, the sample size was obtained through convenience sampling due to the availability and accessibility of the research team. The sample size of 22 participants corresponds to a statistical power of 0.914 for an effect size (ES) of 1.5, obtained in the results section (see figures and tables), assuming an alpha error of 0.05. Nevertheless, the specific characteristics of this sample should be considered, as all participants were high-level WB players with significant achievements at the European level.
MethodologyRotator cuff test: The maximum voluntary isometric contraction (MVIC) of the internal shoulder rotators was measured following previous research.15 using a calibrated force gauge (Chronojump, Barcelona, Spain; 160 Hz). The meter was placed perpendicular (0° inclination) to the vertical axis, at the height of the participant's elbow. One end of the gauge was attached to a handrail, while the other was firmly secured to the participant's wrist using a grip attached to the gauge with a hook to ensure a stable hold. The participants stood perpendicular to the tension meter, in a completely static position in their wheelchairs, with the glenohumeral joint in a neutral position and the elbow flexed at 90°, without allowing any movement of the elbow relative to the torso or variations in the angle of flexion. Each performed two 3-second repetitions, separated by a 15-second rest interval, maintaining a constant force during each repetition. The highest recorded force value (Fmax) and the highest force value maintained for 1 s (FMax AVG 1 s) of the two attempts for each arm were recorded as the best result. Verbal cues were provided to encourage maximum effort. All repetitions were considered for reliability analysis, while the best trial was used for comparative analysis. Asymmetry was assessed using the formula: [(Force Stronger Hand – Force Weaker Hand) / Force Weaker Hand] x 100.16
IMPRP test: IMPRP is a standardized and validated test, previously applied to WB players and wheelchair sports.17–21 From a static position, athletes performed a simultaneous bilateral arm action to generate a single maximum push on the wheelchair rims, after which they returned to the starting position. Participants were encouraged during each repetition. Performance was measured using a linear encoder (Chronojump Boscosystem, Barcelona, Spain; Accuracy: 61 mm; sampling frequency: 1000 Hz), which was attached by a strap to the horizontal axle between the push wheels. The data were recorded with the free Chronojump software, configured to calculate displacement and time in a linear plane. The total mass of the system (athlete plus wheelchair) was entered into the software to calculate the mechanical variables (male: 12.46±1.55 kg; female: 12.95±1.41 kg). The variables analyzed were mean velocity, maximal velocity, mean power, maximal power, mean force, maximal force. Participants performed two repetitions separated by a 30-second passive rest interval. Each repetition was terminated when force production decreased to zero.20 The repetitions were considered for reliability analysis, while the best trial (higher value mean velocity) was used for comparative analyses.
Sprint test: Each participant performed two sets of 12 m sprints in a wheelchair at maximum speed, with a 3-minute rest period. The distance was measured using a tape measure. Times were recorded at 5 and 12 m using six photoelectric sensors (WICHRO: Wireless Race Kit; Chronojump, Barcelona, Spain) that monitored the time and speed of the sprint in real time. The devices were placed facing each other (3 m apart) in pairs at the start, at 5 m and at 12 m. At the start of each test, the players stood on the starting line, with the front wheelchair slightly behind the starting line to prevent false starts. After the signal from the evaluator, who used the words ‘when you want,’ the players were free to start pushing the wheelchair forward, and they were verbally encouraged to perform each repetition at maximum effort, covering the distance of 12 m. Both repetitions were considered for reliability analysis, while the best test (sprint time) was used for comparative analysis.
RSA test: A protocol similar to that used in the study by Weber et al.,.22 Participants completed six 15-m sprints with 10-second active recovery periods between each run. Four photoelectric sensors (WICHRO: Wireless Race Kit; Chronojump, Barcelona, Spain) recorded the time and speed of the sprints, with a separation of 3 m. Participants started at 0.5 m before the first sensor gate to avoid false starts and continued one meter beyond the second gate to avoid deceleration. The fatigue index (FI) was assessed using the formula FI (%) = [(Best velocity – Worst Velocity) / Worst Velocity] x 100.23 After the signal from the evaluator, who used the words ‘when you want,’ the players were free to start pushing the chair forward and were verbally encouraged to perform each repetition at maximum effort. Only a single attempt was performed.
Statistical analysisThe data were analyzed using IBM SPSS Statistics 25.0 (IBM Corp., Armonk, NY, USA), and figures were generated with GraphPad Software 8 Inc. (Boston, MA, USA). Statistical power was assessed using software G*Power 3.1 (Heinrich-Heine-Universität Düsseldorf, Düsseldorf, Germany).
The reproducibility of the performance tests was evaluated using the intraclass correlation coefficient (ICC), coefficient of variation (CV = [SD / mean] × 100), and the standard error of measurement (SEM).24 ICC values below 0.5 indicate poor reliability, values between 0.5 and 0.75 indicate moderate reliability, values between 0.75 and 0.9 indicate good reliability, and values above 0.90 indicate excellent reliability.25
The Shapiro–Wilk test was used to assess the normality of the data. A t-test for independent samples was used to analyze differences between males and females national team players. However, to evaluate the differences between right hand and left hand, a t-test for dependent samples was used. The t-value and confidence interval (CI) 95% were obtained. The effect size (ES), for small sample sizes (n < 20), was calculated using Hedges' g.26 ES values were classified as follows: 0.2 = small effect; 0.5 = moderate effect; 0.8 = large effect.27 A p-value ≤ 0.05 was considered statistically significant.
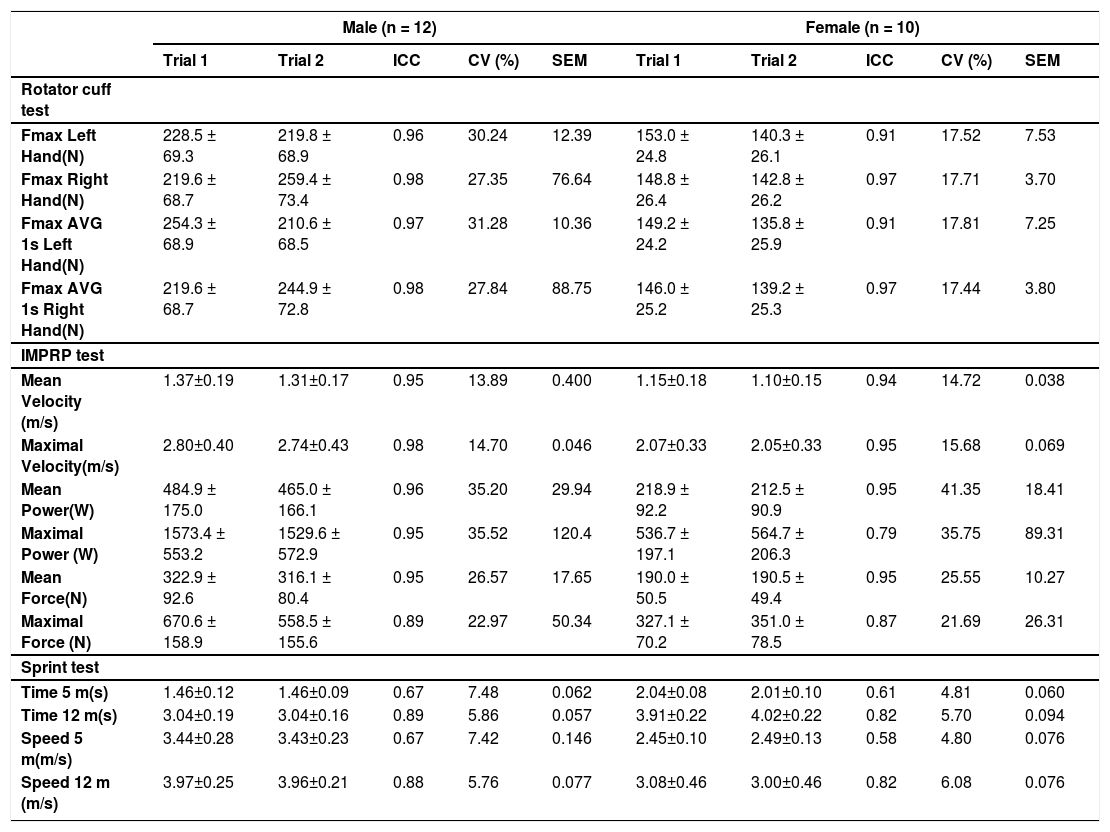
ResultsTest-retest reliabilityTables 2 and 3 summarize the reliability indexes (ICC, CV, SEM) for the physical tests performed. In general, both groups demonstrated at least moderate reliability in all tests. ICC values were generally ≥0.58.
Test–retest reliability of physical performance measures in male and female Spanish national WB players.
AVG: average; ICC: intraclass correlation coefficient; CV: coefficient of variation; SEM: standard error of measurement.
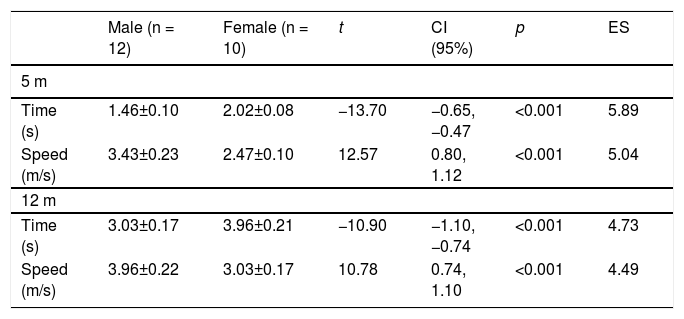
Sprint 5 m and 12 m results in male and female players from national WB team.
CI: confidence interval; ES: Effect size.
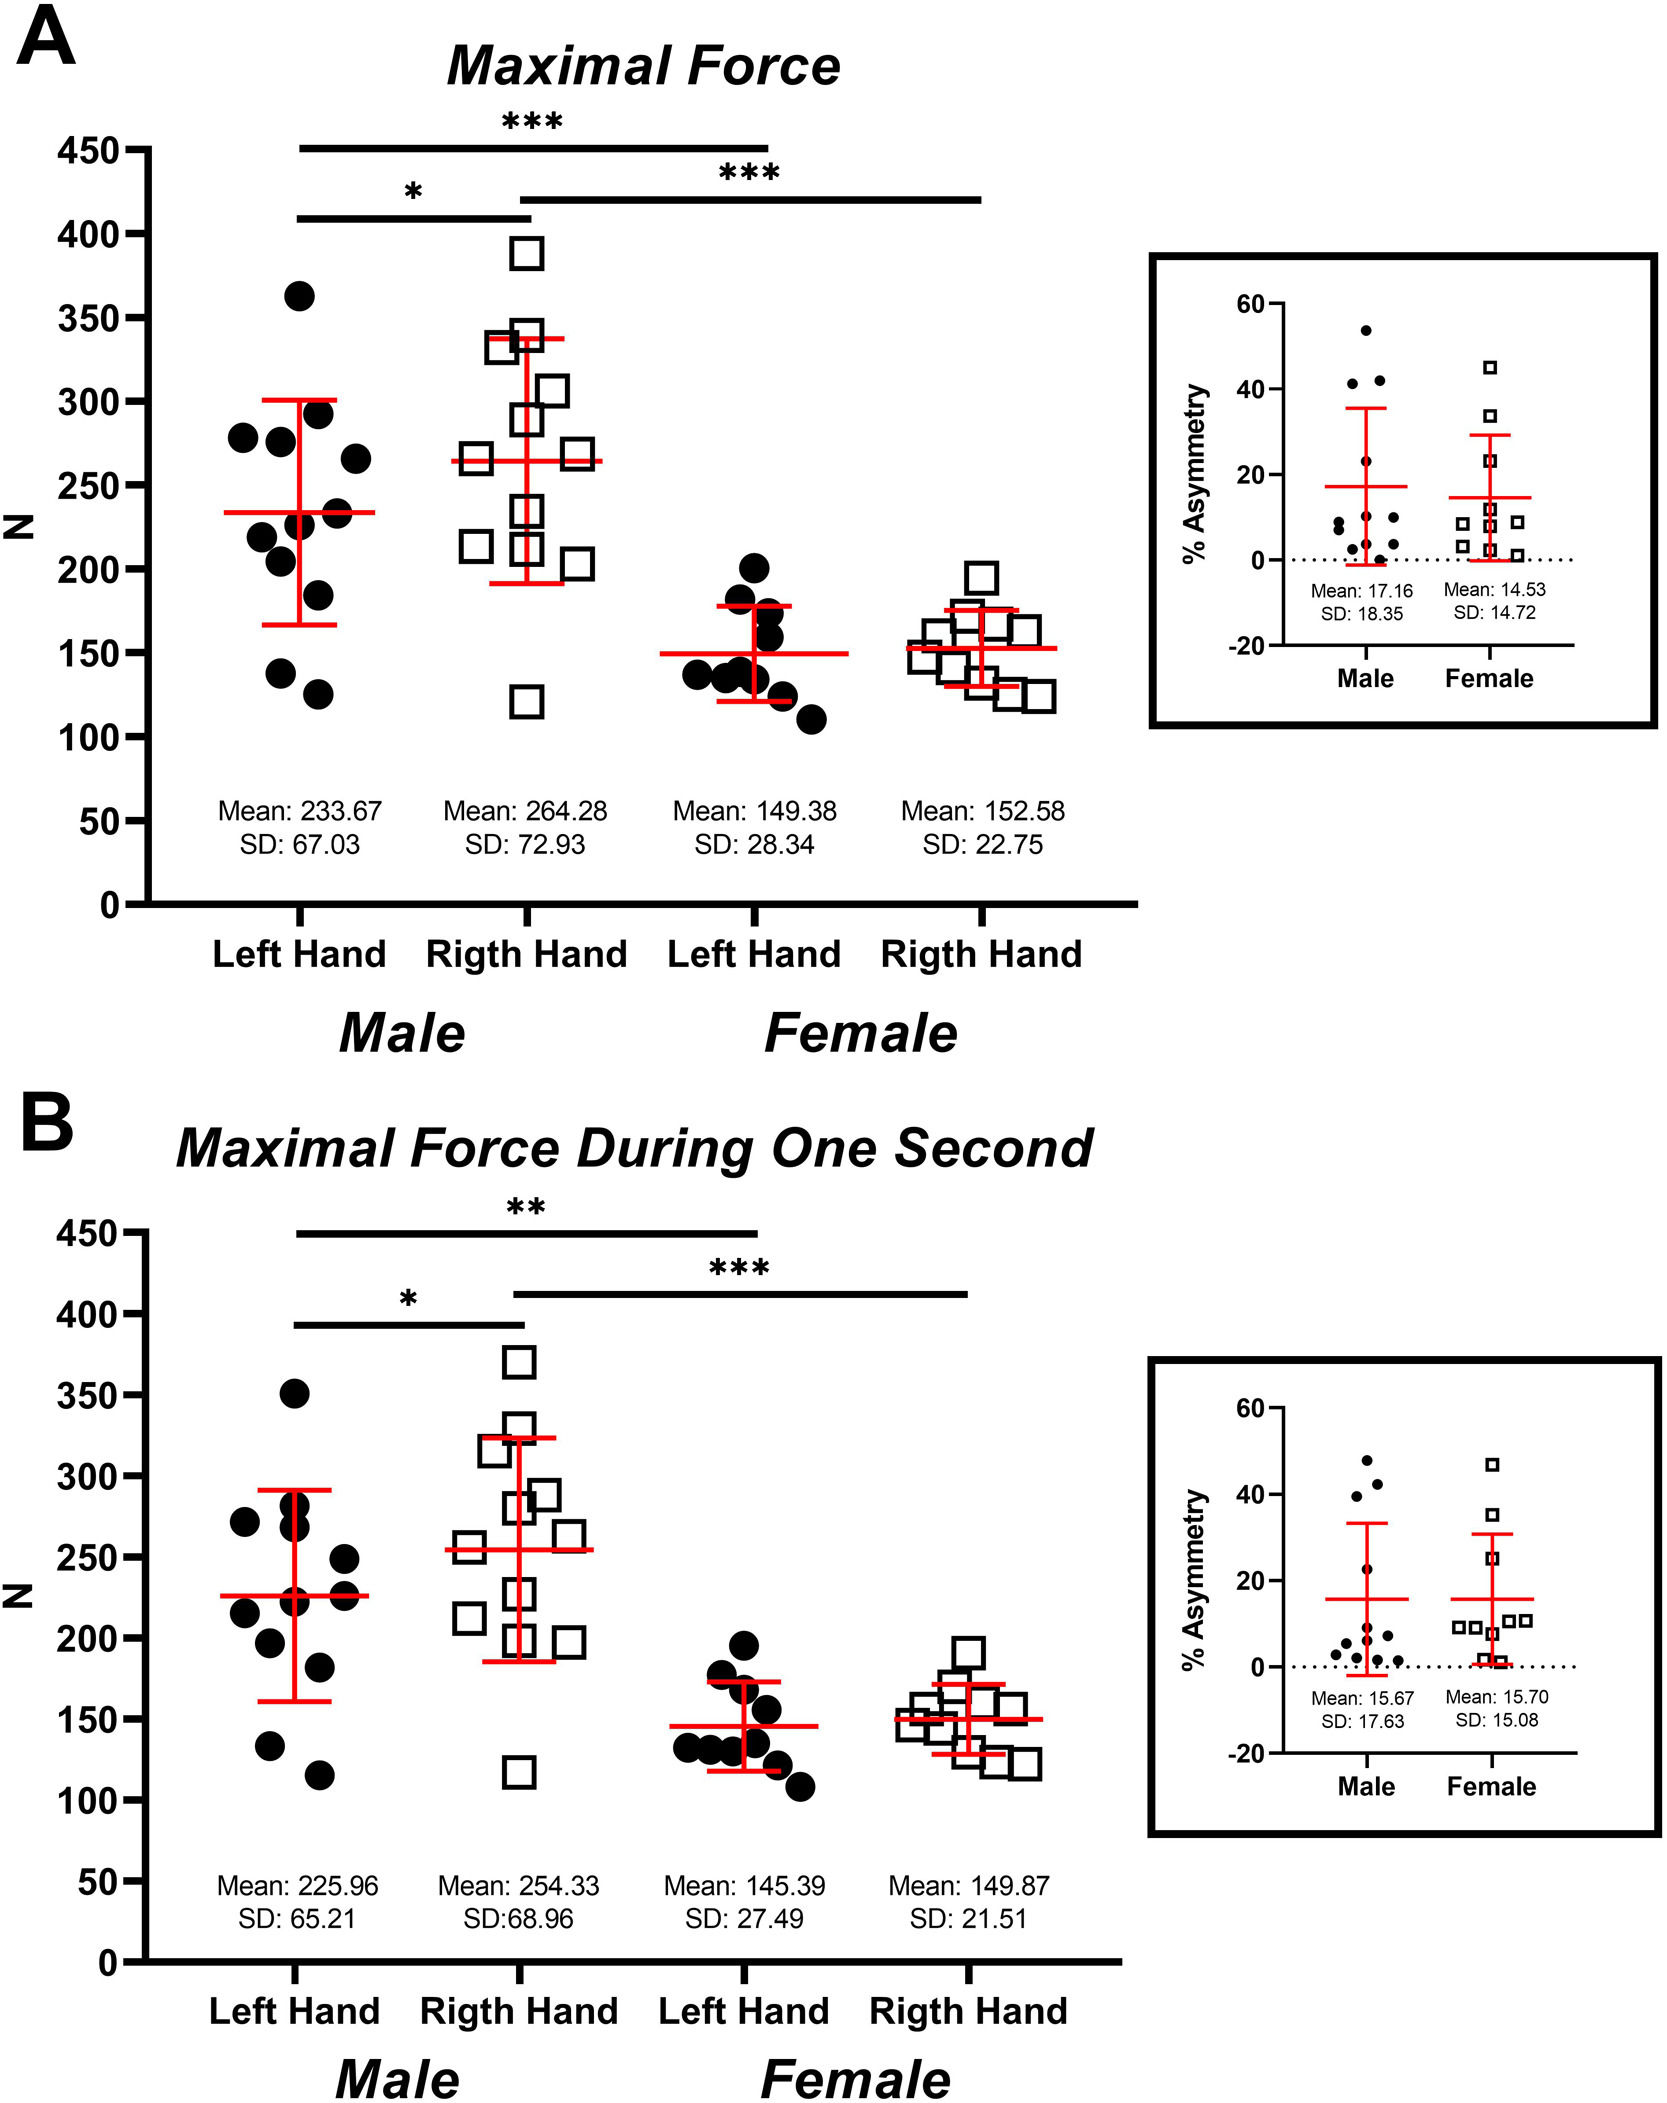
Fig. 1 shows the data from the rotator cuff test. Fig. 1A shows the Fmax values. Significant differences were reported in the left hand (t = 3.95; 95% CI [38.93, 129.72]; p = 0.001; ES=1.50) and right hand (t = 5.02; 95% CI [63.90, 159.56]; p < 0.001; ES=1.96) between male and female national team players. On the other hand, no significant differences between male and female national team players were reported in asymmetries (t = 0.37; 95% CI [−12.08, 17.34]; p = 0.719; ES=0.20). In relation to the above, significant differences were found between the right and left hands in male (t= −2.65; 95% CI [−56.04, −5.18]; p = 0.023; ES=0.44) but not in female (t= −0.35; 95% CI [−23.42, 17.02]; p = 0.729; ES=0.18).

Rotator cuff test results in male and female players from the Spanish national WB team.
Fig. 1B shows the Fmax AVG 1 s values for both sexes. There were significant differences in the left hand (t = 3.63; 95% CI [36.47, 124.92]; p = 0.002; ES=1.52) and right hand (t = 4.96; 95% CI [59.13, 149.73]; p < 0.001; ES=1.96) between national team players. On the other hand, no significant differences were found between male and female national team players in asymmetries (t= −0.004; 95% CI [−14.58, 14.52]; p = 0.996; ES=0.00). In relation to the above, significant differences were found between the right and left hands in male (t= −2.72; 95% CI [−51.34, −5.39]; p = 0.020; ES=0.43) but not female (t= −0.56; 95% CI [−25.14, 15.94]; p = 0.625; ES=0.25).
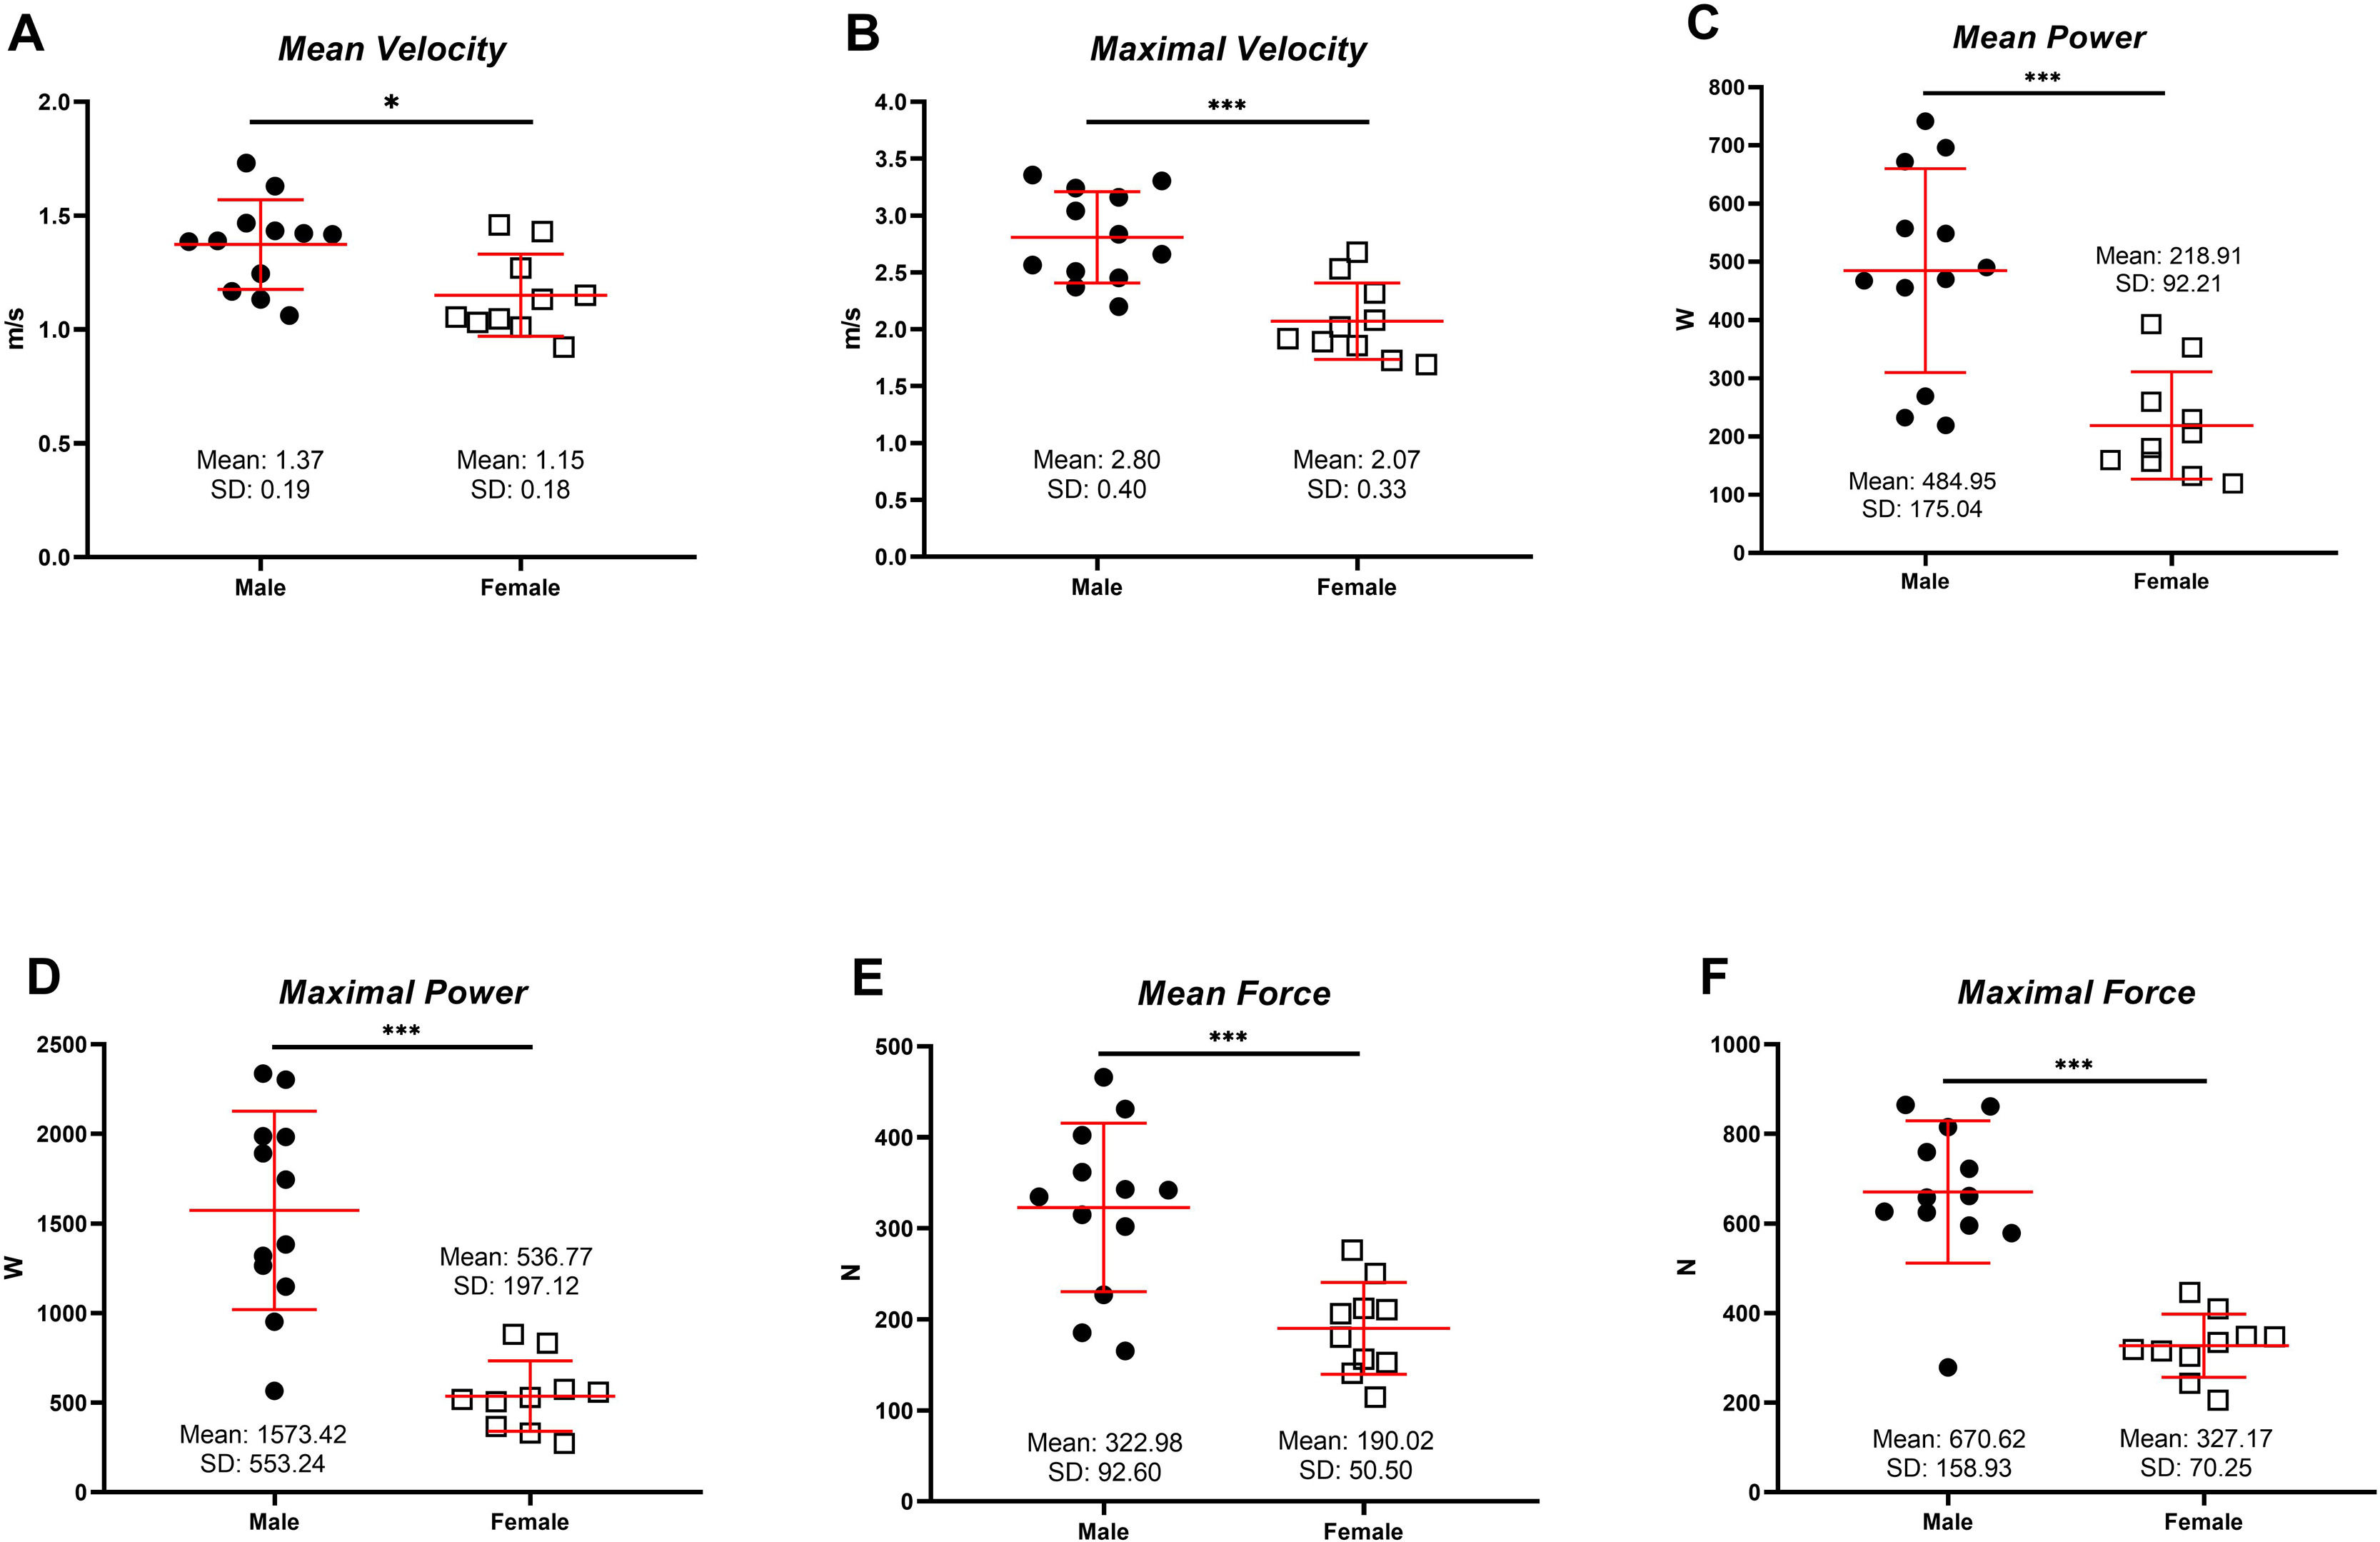
IMPRPFig. 2 shows the values obtained during the IMPRP test. Fig. 2A reports the data obtained for mean velocity. Significant differences were reported between national teams (t = 2.76; 95% CI [0.05, 0.39]; p = 0.012; ES=1.13). Fig. 2B showed significant differences between male and female in maximal velocity values (t = 4.69; 95% CI [0.40, 1.06]; p < 0.001; ES=1.90). Regarding power values, there were significant differences between national teams in average power (t = 4.56; 95% CI [143.06, 389.00]; p < 0.001; ES=1.77) and maximal power (t = 6.04; 95% CI [669.43, 1403.86]; p < 0.001; ES=2.32). Finally, there were also differences in mean force values (t = 4.27; 95% CI [67.41, 198.51]; p < 0.001; ES=1.68) and maximal force (t = 6.73; 95% CI [235.22, 451.68]; p < 0.001; ES=2.64) between male and female national team players.
Sprint 5m and 12 m
Table 3 shows the values obtained in the 12 m sprint test. Significant differences were observed between national teams in the times and Speeds at 5 m and 12 m analyzed (p < 0.001; ES>0.80), with higher performance in male.
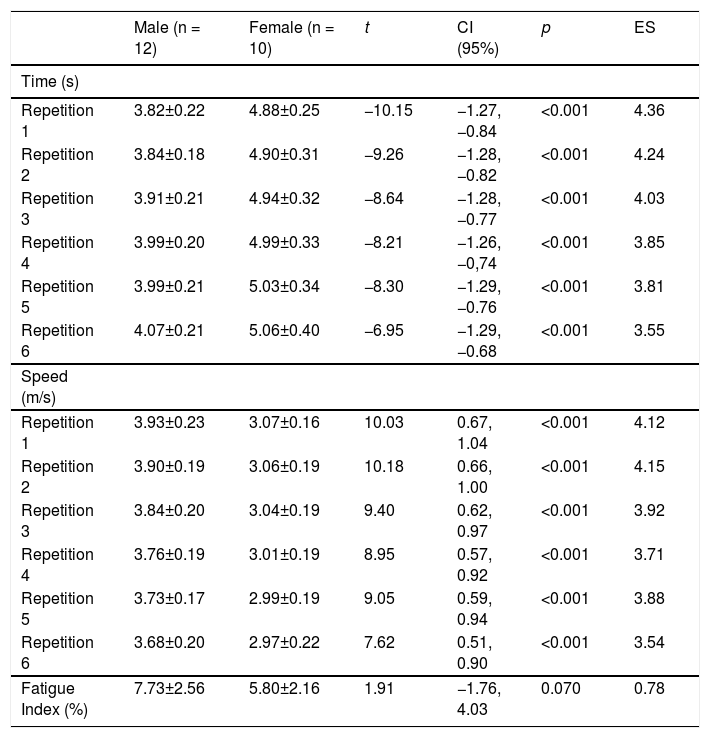
RSA test (6 × 15 m)Finally, Table 4 shows the data obtained during the RSA test (6 × 15 m). As in the previous table, differences between male and female national team players were reported in all sprint times and speeds across the six repetitions analyzed (p < 0.001; ES>0.80), with higher performance in male. However, male obtained a higher percentage of FI compared to female (p = 0.070; ES=0.78).
RSA test (6 × 15 m) results in male and female players from national WB team.
CI: confidence interval; ES: Effect size.
The aim of this research was to analyze the differences in physical performance test between male and female Spanish national WB players. To our knowledge, this is one of the first studies to examine these differences in elite national teams, providing scarce data on female players. The results of this study provide relevant information to the literature on the physical characteristics of elite WB players.13 particularly among female players, for whom available evidence is scarce. Field trials are a viable way to obtain an indication of performance in WB.28 Previously, these sex differences were investigated, but the players were from different leagues.9 Furthermore, in the previous study, it was concluded that sex-related performance differences could be completely offset by subtracting 1.5 functional points from WB players in mixed teams.9 Also, Coutts29 reported that male players exhibited significantly greater speed, acceleration, and maximal power compared to female in a sprint test.
Many wheelchair sports depend on the strength and power of the upper limbs.2,30 Wheelchair propulsion is normally divided into two main phases: the propulsive phase and the recovery phase. The propulsive phase begins with an internal rotation of the shoulder, and the recovery phase begins with an external rotation.31 In the present study, male players obtained higher values in the rotator cuff test and IMPRP compared to female players. To our knowledge, no previous studies have used this test to compare male and female WB players. Similarly, in the study by Cavedon et al.9 male players threw the ball further than female players.
Asymmetry, between the dominant and non-dominant sides, affects efficiency and injury risk in wheelchair sports players, potentially leading to long-term musculoskeletal complications.32 In the present study, no significant differences in asymmetries were found between the right and left hands. It has previously been reported that elite wheelchair rugby players show less variability in power asymmetry compared to sub-elite players, indicating a more efficient and consistent propulsion technique developed through training and experience.33 However, there is a lack of information regarding sex differences in asymmetries in WB players. The absence of significant differences in asymmetries in the present study may be associated with the highly competitive level of the participants.
The IMPRP test is a simple and reliable method providing accurate mechanical output data for WB players' propulsion.20 Its simplicity enables assessment of initial acceleration performance level based on mechanical outputs in elite WB players.17,18 Regarding IMPRP values, in the present study, except for Mean Velocity values, all parameters were significantly higher in male than female players. In relation to a similar sample, Mean Velocity and Maximal Velocity, Mean Power and Maximal Power values in male were higher than those of regional and international WB players.20 In female, Mean Velocity, Mean Power, and Mean Force values were also higher than those reported in international WB players.17 with Pmax, Vmax, and Fmax being similar to the results of the present study. Previous studies have shown that WB matches are characterized by intermittent high-intensity efforts.34 in which sprint acceleration capacity, both from a standing start and over short distances, plays a crucial role in game performance.20,35 The differences observed between national teams could be related to the presence of an innate sexual disparity in the relative characteristics of muscle strength and endurance of the upper body muscles in subjects without disabilities.36 In a previous study of young male and female basketball players.37 better performance in sport-specific field tests was associated with higher scores in game statistics.
It is important to note that strength is one of many factors that could influence sprinting performance in WB.34 Regarding sprinting, significant differences between male and female national team players were reported in both distances analyzed (5 m and 12 m), with male performing better. Unlike Cavedon et al.9 who reported no 5 m sprint differences. However, it should be noted that sprint times were measured using a manual stopwatch. The times reported in the present study are lower compared to other studies in male of the same level or lower leagues.2,31 Similar results have been reported for female.6,17 The reported sex differences could be due to differences in strength. During the first three strides, WB players can maintain a higher stride rate thanks to the force applied at the end of the first stride.38,39
Previous research consistently demonstrates a strong correlation between IMPRP mechanical outcomes—such as speed, acceleration, strength, and power—and sprint times,18–20 highlighting the fundamental role of strength and power in achieving rapid accelerations, which are essential for quick changes of direction and positioning during matches. Similarly, in male WB players, higher mean and relative values of strength and power show large or very large correlations with sprint performance, especially over short distances (3 m), where explosive acceleration provides a competitive advantage over opponents.40 Furthermore, strength and sprinting ability play a decisive role in WB maneuverability performance, as previously reported as.35,41
WB is a sport characterized by intermittent high-intensity efforts.42 Accelerations, decelerations and sprints occur repeatedly and are particularly important in the game.43,44 In the present study, better performance in RSA test was reported in male players. However, the FI was lower in female players. No previous studies have been reported that evaluate sex differences in this physical capacity. A decrease in maximal power during the test has been reported previously.23 Muscular factors (differences in muscle mass and strength, type of predominant muscle fibers, and muscle excitability) and neural factors (neural impulse, muscle recruitment strategies) could explain the decrease in performance during repeated sprints.45 The mechanisms of fatigue are specific to the site in the neuromuscular system, based on the specificity of the task, and should not be assumed to be the same in both sexes.46,47 Females appear to be less susceptible to fatigue than male at low to moderate speeds, although these differences diminish at higher speeds.45,47
LimitationsThe main limitations of the study were as follows: i) Different evaluators conducted the assessments of the male's and female's teams. However, they were experienced and the reliability analyses were above 0.50; ii) The sample size may be small. However, as noted in the materials and methods section, the sample size of 22 participants corresponds to a statistical power of 0.914 for an ES of 1.5. Furthermore, it should be noted that the sample consists of the male’s national team that won the championship and the female national team that placed third in Europe; iii) The training characteristics of the different national team squads, as well as those of individual players, were not recorded; iv) The phase of the menstrual cycle was not monitored in the female WB players. Although sex-related physiological differences may partially explain the observed performance differences, the present findings should be interpreted cautiously because the two groups also differed in several contextual and sport-specific characteristics that were not controlled for in the study (i.e. functional classification, body composition, sporting experience…). Also, the large number of statistical comparisons may have increased the risk of Type I error. However, given the descriptive and exploratory purpose of the study, the analyses were not intended to provide confirmatory hypothesis testing. Therefore, the findings should be interpreted cautiously, considering effect sizes and 95% confidence intervals in addition to statistical significance.
Practical applicationFrom a practical perspective, the physical test performance obtained in this study could provide useful reference points for monitoring WB players during training and competition preparation. Coaches and strength and conditioning practitioners may use these values to identify individual strengths and limitations in upper-limb force production, wheelchair propulsion, sprint performance, and RSA. These assessments may also support the individualization and progression of strength and sprint training programmes, particularly by identifying specific performance qualities that require further development. However, the interpretation of these reference values should consider each player's functional classification, anthropometric characteristics, sporting experience, and other individual factors that may influence physical performance test.
ConclusionMale players from the Spanish national WB team showed higher performance in the rotator cuff, IMPRP, sprint (5 m and 12 m) and RSA (6 × 15 m) tests than female national WB players. However, the asymmetries in the strength values in the rotator cuff test are similar on both teams.
These findings provide reference values for elite wheelchair basketball players. These findings provide preliminary reference data for elite wheelchair basketball, although interpretation should consider the small sample size, team-specific context, functional classification, body composition, experiences and methodological limitations.
Ethics approval statementThe study protocol was approved by the Ethics Committee for Research of the Catalan Sports Council (015/CEICGC/2023), in accordance with the Declaration of Helsinki.
Declaration of generative AI and AI-assisted technologies in the manuscript preparation processDuring the preparation of this work, the authors used ChatGPT and Consensus as AI-assisted tools to support language editing and literature searching. All AI-generated content was critically reviewed and verified by the authors, who take full responsibility for the accuracy, integrity, and content of the published article.
FundingThe authors received no specific funding for this work
Data availability statementThe original contributions presented in the study are included in the article, further inquiries can be directed to the corresponding author.
Author contributionsConceptualization and methodology: G.C, J.S-G and A.G-F; formal analysis, V.T-R and S.L; investigation, J.S-G, R.F, V.T-R, S.L and A.G-F; data curation, V.T-R and A.G-F; writing—original draft preparation, V.T-R, R.F and G.C; writing—review and editing, J.S-G, S.L, G.C and D.S-I; supervision, J.S-G and A.G-F. All authors have read and agreed to the published version of the manuscript.
The authors report no conflict of interest.
We would like to thank the Spanish male and female wheelchair basketball national teams, as well as the "Federación Española de Deportes de Personas con Discapacidad Física", for their time, collaboration, and dedication to this study.