


Age and sport specialization are two of the most important factors that can impact an athlete's flexibility, but their influence during adolescence in youth athletics hasn’t yet been investigated.
Material and methodsRetrospective analysis of the lower limb flexibility assessments in the athletics squad of a full-time sports academy in the Middle East for nine consecutive seasons (2006/07 to 2014/15). Flexibility data were analyzed for eight lower limb muscle groups (mean value±standard deviation) in four athletics events (throws, sprints & jumps, distance running and non-specialized) and seven age groups (categorized yearly from under 13 to above 18 years old). Total lower limb flexibility (TF) was calculated by summating all individual muscle group values and comparisons were made between age groups and athletics events with statistical significance set at p<0.05.
Results127 adolescent athletes (age=15.4±1.8 years) completed, in total, 604 flexibility tests. No statistically significant differences between right and left were found for any muscle (p>0.05). A weak inverse correlation (r=−0.21, p<0.001) was found between age and TF, with no significant changes in hamstrings, adductors and hip flexors (p>0.05). Throwers were found to be significantly less flexible (1091±93) than distance runners (1227±95), sprints & jumps (1186±80) and non-specialized athletes (1178±78); distance runners displayed greater hip external rotators flexibility than any other group (p<0.01), and up to 78% more than throwers.
ConclusionsThis research confirmed that throwers were the least flexible of all events in youth athletics. Overall lower limb flexibility appears to decrease during adolescence, although hamstrings, adductors and hip flexors remained unchanged.
Flexibility is, along with strength, speed and endurance, one of the basic physical attributes for sports performance and adolescence is one of the most important and sensitive periods in the development of these attributes in an athlete. Flexibility, defined as the intrinsic property of the body tissues that determines the range of motion achievable without damage,1 is known to progress negatively during an athlete's life,2–4 although its evolution during adolescence, when exposed to high intensity training, remains unknown. Growth appears to positively influence physical performance in terms of strength, speed and endurance,5–8 but the lack of evidence on whether flexibility is negatively influenced by growth through adolescence remains unclear. Important musculoskeletal changes occur during this period, when different body segments rapidly grow longitudinally,9,10 challenging the tissue capacity to adapt to new movement patterns. Some studies report that flexibility decreases during adolescence,4,11 others report that this decrease can start as early as 5–8 years of age,12,13 but others suggest that adolescent growth is not associated with any changes in flexibility.14 However, most of these studies were not carried out on a sporting population and specifically not on athletics population.
Flexibility can also be influenced by the type of physical activity and sports specialization undertaken. It is unclear if it is the sport itself which influences an athlete's flexibility or is the individual athlete's flexibility characteristics that work as a “natural selection” to allow a better sports performance, particularly if an athlete has commenced the sport at an early age. Swimmers have shown to have more flexibility in ankles and shoulders,15 pitchers and tennis players greater gleno-humeral external rotation,16,17 karate players increased hip flexibility,18 or wrestlers greater neck and shoulder abduction.19 A specific event or position may also be influential; football goalkeepers are more flexible than field players20 and linemen less flexible than any other player in American football.21 Performance level is also key; increased flexibility is demonstrated in high level swimmers,15 gymnasts22 and wrestlers19 compared to amateurs.
To be able to define an optimal flexibility for each sport or discipline, reference values are needed for specific athletic populations. There have been many studies describing physiological profiles for different sports such as football, gymnastics, wrestling, or taekwondo,21–24 but a specific flexibility profile has not, as yet, been defined in athletics or any of its disciplines. Considering athletics is a combination of multiple disciplines, throwers, sprinters, jumpers and long-distance runners, different lower limb flexibility demands may be required, with adolescence being a key period for adaptation to the event-specific demands. Establishing profiles for adolescent athletes according to their athletics event specialization may help adjusting realistic expectations according to their expected lower limb flexibility. This study aims to explore any specific lower limb flexibility patterns which may emerge, for the main athletics disciplines and age groups from 12 to 18 years old in highly-trained adolescent athletes.
Materials and methodsA retrospective analysis of all lower limb flexibility data collected for the athletics squad in an elite sports academy in the Middle East was undertaken. Flexibility measures were taken for 9 consecutive seasons (2006/07 through 2014/15) as part of the physical screening tests routinely carried out in the academy. Ethical approval for the use of the flexibility measures, which are part of the routinely collected screening data for scientific purposes, was given by the Anti-Doping Lab Qatar Institutional Review Board (Ethics number E20140000012). Informed consent was granted by the parents at the beginning of each season prior to any data collection.
A video-based measurement of flexibility designed for adolescent athletes was used, according to the protocol described by Fourchet et al. (2013).25 Eight lower limb muscle groups were tested bilaterally: quadriceps (QUAD), hamstrings (HAMS), adductors (ADD), gastrocnemius (GAST), soleus (SOL), hip flexors (HIPFLEX), hip internal rotators (INTROT) and hip external rotators (EXTROT). The measurement endpoint for each muscle was reflected by the angle of the joint of interest with the application of a standardized force on the distal part of the segment. The force was applied by means of a hand-held dynamometer (Compact force gauge, Mecmesin, Slinfold, UK) just proximal to the malleolus level for each tested muscle groups, except for the hip flexors (above the patella) and calf muscles (on the heads of metatarsals at the plantar side of the foot). A specific force was defined for each muscle group (QUAD=78N, HAMS=68N, ADD=39, GAST=147N, SOL=147N, HIPFLEX=98N, INTROT=49, EXTROT=49N). Once the endpoint angle was reached, a video capture was made (Digital video camera recorder, DCR-SR220E, Sony Corporation, Tokyo, Japan) by a second operator, which is then analyzed using digital video analysis software (Dartfish Software, Fribourg, Switzerland). The results were then entered into a password protected database which was managed by the medical staff for screening and injury prevention purposes. The standard positions for data collection for each muscle group and the protocol for angle correction are showed in Fig. 1A–H.
. (A) Quadriceps=180°−x. (B) Hamstrings=x−90°. (C) Adductors=x. (D) Gastrocnemius=180°−x. (E) Soleus=180°−x. (F) Hipflexors=180=180°−x. (G) Hip medial rotators=x. (H) Hip lateral rotators=x.")
Video-capture of the endpoint angle positions for eight different muscles based on standardized dynamometer values, and calculation of final value for each muscle (being ‘x’ the primary measurement). (A) Quadriceps=180°−x. (B) Hamstrings=x−90°. (C) Adductors=x. (D) Gastrocnemius=180°−x. (E) Soleus=180°−x. (F) Hipflexors=180=180°−x. (G) Hip medial rotators=x. (H) Hip lateral rotators=x.
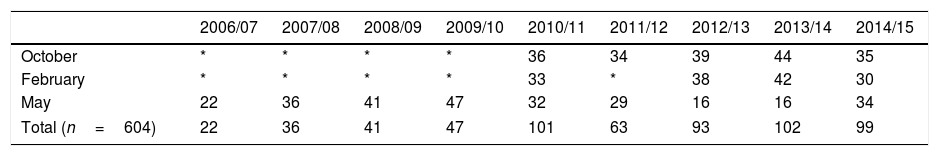
Flexibility measurements were captured by the academy physiotherapy team who were trained on the technical procedures for the tests on each occasion. The same room, time (7–9 am) and procedures (no previous warm up, same sequence of muscle groups and consistent pairs of testers and recorders) were used annually for the first 4 seasons (2006/2007 to 2009/2010) and then 3 times per season (beginning, mid and end of season) for the next 5 seasons (2010/2011 to 2014/2015). Testing calendar and number of athletes tested per session is presented in Table 1.
A total lower limb flexibility value (TF) was calculated for each athlete-test by summating all muscle group results, higher values indicating greater overall lower limb flexibility.
Study group and data categorizationAll athletes in the athletics squad, tested for flexibility for the 9-season period, were included for analysis. Full time athletes (all males) followed comprehensive training sessions 8 times per week around the school calendar and competed at national to international level events. All athlete-tests were reviewed, analyzed and categorized by age and event following specific criteria; seven age groups were established according to the age on the day of testing with one-year increments from under 13 years (U13; age <13.0) to above 18 years (>18).
The athletics program was structured towards eventual athletics specialization, with younger athletes (12–15 years) following a general athletics development program (non-specialized) and older athletes (above 15) specializing in one of the four event-groups: sprints, jumps, long distance running and throws. Sprints and jumps were training as a single group for most of the seasons, therefore they were categorized together as sprints & jumps, while the rest of the groups were categorized according to the event the athlete was part of on the day of testing.
Data analysis and statistical methodsMean values were calculated for each muscle group by age group and event and expressed in degrees±standard deviation (STD). A paired T-test was used to ascertain potential differences between left and right. Statistical analysis was carried out to explore comparisons between events and age groups for TF and all muscle groups individually. Analysis of Variances (ANOVA) was used when comparisons were made among events and age groups. Logistic regression was done to analyze the relationship between age and total flexibility. The level of significance was established at p<0.05. Statistical analyses were carried out using Statistical Package for Social Sciences (version 17, SPSS Inc., Chicago) software.
ResultsOne-hundred and twenty-seven male youth athletes underwent, in total, 604 flexibility tests corresponding to 18 test batteries from October 2006 to May 2015. Mean age at test date was 15.4±1.8 years, and athletes’ origin were essentially Middle Eastern countries (72%), North & East Africa (23%), and others (5%). Athlete distribution by age group was: U13=52, U14=103, U15=116, U16=110, U17=106, U18=68 and >18=49.
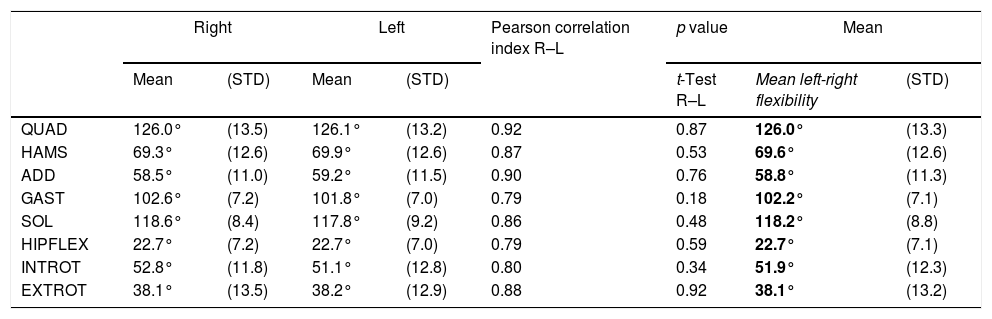
Mean value for total flexibility (TF) was 1175±94.3. Mean values for each muscle group are described in Table 2. There were no significant differences between left and right for any muscle group, so a single reference value per muscle group, resulting from the mean left and right results was calculated.
Mean values (±STD) for right and left for each muscle group. A single value averaging L and R is showed with (±STD). QUAD: quadriceps; HAMS: hamstrings; ADD: adductors; GAST: gastrocnemius; SOL: soleus; HIPFLEX: hip flexors; INTROT: hip internar rotators; EXTROT: hip external rotators.
| Right | Left | Pearson correlation index R–L | p value | Mean | ||||
|---|---|---|---|---|---|---|---|---|
| Mean | (STD) | Mean | (STD) | t-Test R–L | Mean left-right flexibility | (STD) | ||
| QUAD | 126.0° | (13.5) | 126.1° | (13.2) | 0.92 | 0.87 | 126.0° | (13.3) |
| HAMS | 69.3° | (12.6) | 69.9° | (12.6) | 0.87 | 0.53 | 69.6° | (12.6) |
| ADD | 58.5° | (11.0) | 59.2° | (11.5) | 0.90 | 0.76 | 58.8° | (11.3) |
| GAST | 102.6° | (7.2) | 101.8° | (7.0) | 0.79 | 0.18 | 102.2° | (7.1) |
| SOL | 118.6° | (8.4) | 117.8° | (9.2) | 0.86 | 0.48 | 118.2° | (8.8) |
| HIPFLEX | 22.7° | (7.2) | 22.7° | (7.0) | 0.79 | 0.59 | 22.7° | (7.1) |
| INTROT | 52.8° | (11.8) | 51.1° | (12.8) | 0.80 | 0.34 | 51.9° | (12.3) |
| EXTROT | 38.1° | (13.5) | 38.2° | (12.9) | 0.88 | 0.92 | 38.1° | (13.2) |
Bold is the average left-right value per muscle group.
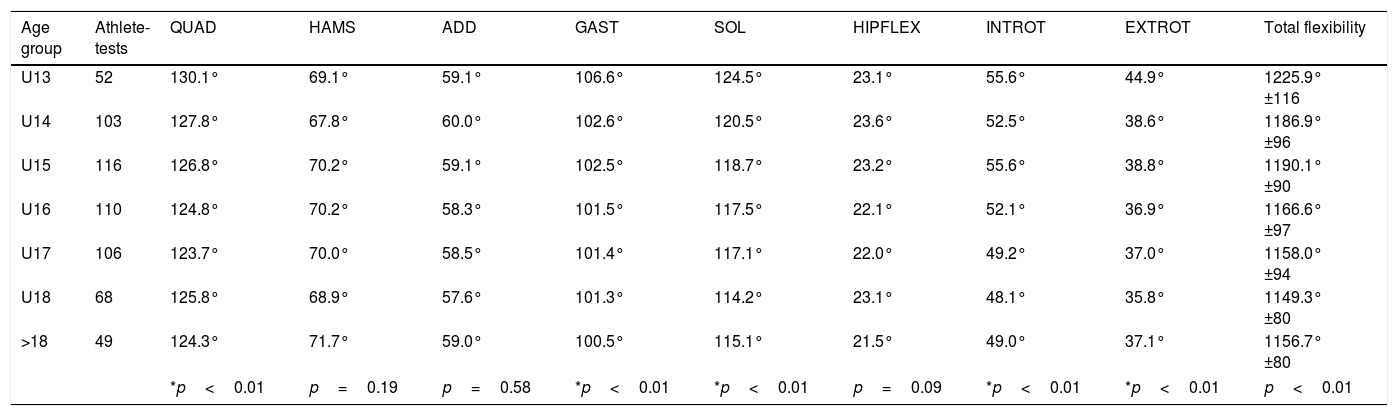
When analyzing muscle flexibility by age groups, statistically significant differences were found for QUAD, GAST, SOL, hip INTROT and hip EXTROT (p<0.01). In all cases, the evolution of flexibility was negative, showing lower values in older age groups. Age did not appear to influence HAMS (p=0.19), ADD (p=0.58) and HIPFLEX (p=0.09). Mean values for each muscle group and TF by age group are showed in Table 3.
Mean values by age groups and muscle group, including total flexibility (±STD). *Statistical significance set at p<0.05. QUAD: quadriceps; HAMS: hamstrings; ADD: adductors; GAST: gastrocnemius; SOL: soleus; HIPFLEX: hip flexors; INTROT: hip internar rotators; EXTROT: hip external rotators.
| Age group | Athlete-tests | QUAD | HAMS | ADD | GAST | SOL | HIPFLEX | INTROT | EXTROT | Total flexibility |
|---|---|---|---|---|---|---|---|---|---|---|
| U13 | 52 | 130.1° | 69.1° | 59.1° | 106.6° | 124.5° | 23.1° | 55.6° | 44.9° | 1225.9° ±116 |
| U14 | 103 | 127.8° | 67.8° | 60.0° | 102.6° | 120.5° | 23.6° | 52.5° | 38.6° | 1186.9° ±96 |
| U15 | 116 | 126.8° | 70.2° | 59.1° | 102.5° | 118.7° | 23.2° | 55.6° | 38.8° | 1190.1° ±90 |
| U16 | 110 | 124.8° | 70.2° | 58.3° | 101.5° | 117.5° | 22.1° | 52.1° | 36.9° | 1166.6° ±97 |
| U17 | 106 | 123.7° | 70.0° | 58.5° | 101.4° | 117.1° | 22.0° | 49.2° | 37.0° | 1158.0° ±94 |
| U18 | 68 | 125.8° | 68.9° | 57.6° | 101.3° | 114.2° | 23.1° | 48.1° | 35.8° | 1149.3° ±80 |
| >18 | 49 | 124.3° | 71.7° | 59.0° | 100.5° | 115.1° | 21.5° | 49.0° | 37.1° | 1156.7° ±80 |
| *p<0.01 | p=0.19 | p=0.58 | *p<0.01 | *p<0.01 | p=0.09 | *p<0.01 | *p<0.01 | p<0.01 | ||
A tendency of a decrease in TF in the older age groups was observed and a negative correlation index was found (r=−0.21; r2=0.04; p<0.01) when a regression analysis was conducted between age and TF (Fig. 2), indicating that overall lower limb flexibility tends to decrease towards late adolescence.
. Significant decrease p<0.01.")
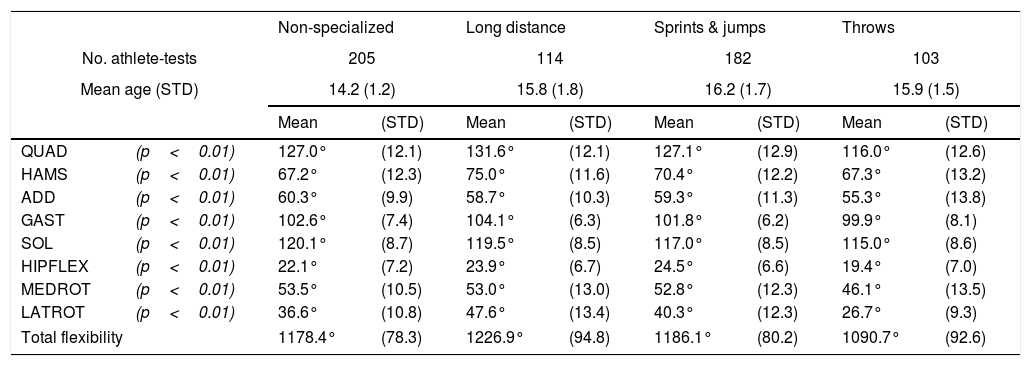
When categorizing all athlete-tests by athletics event, 205 belonged to non-specialized athletes, 114 to long distance runners, 182 to sprints & jumps, and 103 to throwers. Mean values for each muscle group per athletics event are presented in Table 4. Throwers were less flexible for all muscle groups (p<0.001), while long distance runners were the most flexible overall and for QUAD, HAMS and EXTROT. Sprints & jumps had more HIPFLEX flexibility. In terms of TF, there were also statistically significant differences (p<0.001) between groups, throwers being significantly less flexible than any other group.
Mean values per athletics event for each muscle group and total flexibility. QUAD: quadriceps; HAMS: hamstrings; ADD: adductors; GAST: gastrocnemius; SOL: soleus; HIPFLEX: hip flexors; INTROT: hip internar rotators; EXTROT: hip external rotators.
| Non-specialized | Long distance | Sprints & jumps | Throws | ||||||
|---|---|---|---|---|---|---|---|---|---|
| No. athlete-tests | 205 | 114 | 182 | 103 | |||||
| Mean age (STD) | 14.2 (1.2) | 15.8 (1.8) | 16.2 (1.7) | 15.9 (1.5) | |||||
| Mean | (STD) | Mean | (STD) | Mean | (STD) | Mean | (STD) | ||
| QUAD | (p<0.01) | 127.0° | (12.1) | 131.6° | (12.1) | 127.1° | (12.9) | 116.0° | (12.6) |
| HAMS | (p<0.01) | 67.2° | (12.3) | 75.0° | (11.6) | 70.4° | (12.2) | 67.3° | (13.2) |
| ADD | (p<0.01) | 60.3° | (9.9) | 58.7° | (10.3) | 59.3° | (11.3) | 55.3° | (13.8) |
| GAST | (p<0.01) | 102.6° | (7.4) | 104.1° | (6.3) | 101.8° | (6.2) | 99.9° | (8.1) |
| SOL | (p<0.01) | 120.1° | (8.7) | 119.5° | (8.5) | 117.0° | (8.5) | 115.0° | (8.6) |
| HIPFLEX | (p<0.01) | 22.1° | (7.2) | 23.9° | (6.7) | 24.5° | (6.6) | 19.4° | (7.0) |
| MEDROT | (p<0.01) | 53.5° | (10.5) | 53.0° | (13.0) | 52.8° | (12.3) | 46.1° | (13.5) |
| LATROT | (p<0.01) | 36.6° | (10.8) | 47.6° | (13.4) | 40.3° | (12.3) | 26.7° | (9.3) |
| Total flexibility | 1178.4° | (78.3) | 1226.9° | (94.8) | 1186.1° | (80.2) | 1090.7° | (92.6) | |
This study has resulted in lower limb flexibility being described for the first time in youth athletics. A consistent methodology for lower limb flexibility assessment from 2006/07 through 2014/15 allowed comparisons between highly-trained youth athletes in a full-time sports academy. Different patterns were observed among athletics events, throwers being the least flexible group and long distance the most flexible one, especially for hamstrings and hip rotators. Flexibility showed a trend to decrease in late adolescence for all groups, although hamstrings, adductors and hip flexors remained unchanged. Important considerations should be taken when interpreting these results.
Age and flexibilityA weak negative correlation between age and total lower limb flexibility was found in this study with a sample of 604 athlete-tests ranging from 11.4 to 21.4 years of age. These findings are similar to previous studies4,11 and confirm that lower limb flexibility continues to decrease during adolescence, not only in the school population, but also in highly trained athletes. Considering that flexibility is known to progressively decrease throughout life, a statistical analysis for the adolescent period alone is probably not enough to find strong correlations. Longitudinal analyses of longer periods, including adulthood, would probably be more relevant to explore if the evolution of flexibility during adolescence is different to other periods.
Age, however, does not appear to affect the flexibility of all muscle groups in the same way: while TF and essentially flexibility of most muscle groups decreased with age, hamstrings, adductors and hip flexors did not appear to change. The reason for this is unknown and would need further investigation, but other structures in addition to the muscle may be involved in the flexibility of these muscle groups, therefore limiting the potential effect of age on muscle flexibility. Hamstring measurements may be hindered by the sciatic nerve tension when this specific method of measurement is used, while adductors and hip flexors may be influenced by the anatomical range of motion allowed by the hip joint. A cam morphology of the hip has been strongly correlated with intense physical activity during adolescence,26 therefore it is likely the femoral head morphology and not the muscle which limits the hip range of motion.
In addition, a year-by-year group subdivision may not be relevant during adolescence, as chronological age and skeletal maturity rarely match on an individual basis. Furthermore, different athletics disciplines may have different maturity bias, with a predominance of skeletally mature athletes among sprinters, jumpers and throwers, and a higher proportion of late mature athletes in endurance events.27–29 This would result in skeletally older athletes being categorized in the same age group as their skeletally younger counterparts, leading to a results bias if there is a predominance of early maturing athletes in the sample. Since maturity status information is not always available, a chronological age subdivision remains the most practical categorization when comparing flexibility across adolescent athletes.
Event specialization and flexibilityDifferent lower limb flexibility patterns were found between athletics events. Our data has shown that throwers are less flexible than athletes in any other event-group, which could be related to a primary focus in upper body and trunk range of motion to the detriment of the lower limbs. Distance runners however turned out to be the most flexible group, which was unexpected as an association between less flexibility and better running economy has been found in long-distance runners.30–33 Wang et al.31 noted that long distance runners had less flexibility in soleus and hamstrings than non-runners, which may be related to a more efficient use of the muscle's elastic energy. Gleim et al.,30 Craib et al.32 and Trehearn and Buresh33 also found that less flexible runners were up to 12% more economic than those with greater flexibility, suggesting that inflexibility in certain areas of the musculoskeletal system may enhance running economy by increasing storage and return of elastic energy and minimizing the need for muscle-stabilizing activity. Whether this happens later in life or as an adaptation to prolonged training is unknown and goes beyond the analysis of this study, but such findings did not match this cohort.
One of the biggest differences in flexibility between events was found for the lateral rotators of the hip (range of motion (ROM) for hip internal rotation), with distance runners having up to 78% more ROM than throwers or 15% more than S&J. It has been suggested that both testing position and age can influence normative values for hip ROM, as well as if the test subject is a runner or not.34 According to Schache et al. (1999),35 hip internal rotation seems to be implicated in the coordinated movement of the lumbo–pelvic–hip complex during running, but whether an excessive hip internal rotation may be related to a better running economy36 or to a greater risk of overuse injuries37 remains unclear.
Flexibility and stretchingAmongst both athletes and coaches, there still exists the generalized thought that increased flexibility is related to a lower injury risk, however research has shown that these two parameters do not have a direct relationship.38–40 It even seems that, in some cases, a forced increase in flexibility by means of specific stretching technics is related to a greater injury risk41 and it may be an athlete's own individual muscle imbalances which are related to injuries,38 rather than a lack or even an excess of flexibility. At this moment in time there is not enough scientific evidence to advise against stretching as part of athletic training,42 but rather than focusing exclusively on gaining flexibility indiscriminately, flexibility should adapt to each sport, discipline and athlete's characteristics.
Methodological limitationsDespite having a large and consistently collected amount of data (18 testing periods for 9 sport seasons), there was a high heterogeneity of follow up periods with varying time frames between tests. A longitudinal analysis per athlete was then not possible, so each test had to be analyzed individually (athlete-test).
Different flexibility patterns are described for each event and age group; however, practitioners should be cautious when extrapolating these results to similar cohorts. Primarily adolescent athletes may not be, as yet, fully specialized, therefore comparisons between events may not be as clear as in senior athletes. Secondly, although statistically significant differences were found between groups, its relevance may be questionable in a muscle by muscle analysis. In some cases, the differences are less than 5 degrees, which may not be clinically relevant knowing that the coefficient of variation of the method ranges from 2 to 9% for most muscles.25 Accordingly, TF is probably more reliable when establishing comparisons between groups providing a better indication of global lower limb flexibility. Overall flexibility had already been used by Bennell and Crossley (1996)43 in a previous study in athletics, but with a much smaller number of muscles included. Finally, and although the validation of this method showed a moderate to good reliability in adolescent athletes, a prospective design is always preferable to a retrospective analysis in which many confounding factors may not have been identified.
Longitudinal studies with the presence of a non-sporting control group or with athletes of other sports are recommended for further studies, as well as investigating the relationship between flexibility and injuries and flexibility with maturity status and skeletal age.
FundingNo funding was received from any institution for this study.
Conflict of interestThe authors declare that they don’t have any conflict of interest.
The authors would like to acknowledge Olivier Matterne, Abdalla Rejeb, Francois Fourchet, Cosmin Horobeanu, Tomas Hudacek, Daniel Sebo and the whole physiotherapy team at Aspire Academy during the period of the study for their great effort in data collection.

