


This study aimed to assess the validity and reliability of the My Jump® 2 app for measuring vertical jump height on sand. We hypothesized that the app would demonstrate good reliability (ICC > 0.75) and acceptable agreement (bias < 2 cm, CCC ≥ 0.95) with 2D video analysis.
MethodsTwenty-six male beach volleyball players performed four types of vertical jumps (CMJ, SJ, AJ, BJ) on sand. Jump height was measured using the My Jump® 2 app and 2D video analysis (Kinovea). Reliability was assessed with ICC(2,1), SEM, and MDC95. Validity was assessed using Pearson correlation, Lin’s Concordance Correlation Coefficient (CCC), Bland-Altman analysis (bias and 95 % limits of agreement), and linear regression to evaluate proportional bias and standard error of estimate (SEE).
ResultsICCs ranged from 0.447 to 0.594. SEM varied from 4.68 to 8.39 cm and MDC95 ranged from 12.98 to 23.24 cm. Pearson correlations were high (r = 0.713–0.832), but CCC values indicated only moderate agreement (CCC = 0.487–0.632). The My Jump® 2 app consistently overestimated jump height, with bias ranging from 5.38 to 6.91 cm. Limits of agreement ranged from -11.33 to 22.08 cm. Linear regressions revealed proportional bias in all jump types.
ConclusionMy Jump® 2 showed good reliability but limited agreement with the reference method on sand. While the app may be suitable for monitoring performance trends, its absolute accuracy is compromised under these conditions and should be interpreted with caution.
Vertical jump (VJ) performance is widely used to monitor neuromuscular status in sports. Although My Jump® 2 has shown validity on firm surfaces, the unique biomechanics of sand surfaces due to their compliance introduce potential measurement challenges. Prior studies have not tested the app’s agreement on sand. Therefore, this study aimed to assess the validity and reliability of My Jump® 2 on sand, hypothesizing that it would demonstrate good reliability (ICC > 0.75) and acceptable agreement (bias < 2 cm; CCC ≥ 0.95) compared to a validated method.
Different methods and devices can be used to measure VJ performance, such as force plates (method based on the double integration of vertical reaction force) and kinematic analysis. Although these measures are considered the gold standards,1 other methods can also be used, such as contact mats,2 linear transducers,3 and mobile apps.4 Some aspects, such as usability and practicality, are important when choosing equipment, added to which some equipment can be expensive and difficult to transport to training locations. Therefore, several studies have focused on investigating the validity and reliability of low-cost instruments that can be used more easily in specific training environments.3,5,6
In this sense, the use of smartphone applications such as My Jump® have become widely used. This app records videos of different vertical jump tasks and calculates jump height from the flight time based on the take-off and landing frame information. Previous studies have analyzed the validity and reliability of My Jump® in different populations, including older people,7 recreationally active adults,8 Judo players,9 and male and female athletes.10 However, a common aspect in the studies is the performance of vertical jumps on a rigid surface. Recently, Medeiros et al.11 investigated the validity and reliability of My Jump 2 to measure vertical jump height in women volleyball players on sand surfaces. The authors reported that this tool is valid for measuring jump height and flight time of the countermovement jump (CMJ) on sand surfaces.
Although there are many advantages to using the My Jump®, there are several types of bias that may impact the measure, such as how to identify the take-off and landing frames of the video, and the level of knee and ankle flexion (dorsiflexion) before landing.12 There is evidence that when performing vertical jumps on an irregular surface, such as sand, kinematic changes occur in the joints of the lower limbs, leading to greater range of movement in these joints,13 because the sand surface makes it difficult to apply force against the ground during the vertical jump.14 In this way, kinematic changes in the lower limbs during landing can influence the time of flight and, consequently, the height of the vertical jump.
Furthermore, some sports, such as beach volleyball, present great physical demands during jumps and displacements,15 therefore, evaluating these physical capabilities in the specific context of the game is essential. With this in mind, it is necessary to confirm or refute some questions about the My Jump® 2 app, such as: is the My Jump® 2 app capable of estimating the height of different types of vertical jumps performed on sandy ground, as occurs in jumps measured on a rigid surface? Can this be considered a reliable instrument? Thus, the aim of the current study is to test the reliability and criterion validity of the My Jump® 2 to assess height in different vertical jump tests on a sand surface. Based on these assumptions, we hypothesized that the MyJump 2 app would demonstrate good reliability and acceptable agreement (bias <2 cm; CCC ≥ 0.95) with 2D video analysis for vertical jumps performed on sand.
Materials and methodsParticipantsTwenty-six male beach volleyball players (age 25.6 ± 5 years, height 180.2 ± 0.05 cm, body mass 76.2 ± 9.64 kg, lower limb length 110 ± 5.05, and squat height 75.39 ± 7.33) participated in the study; the selection method was through convenience sampling. Players were required to meet the following criteria to be included in the research: i) aged over 18 years; ii) be a federated beach volleyball player who participated in at least one official competition in 2022 (tiers 2–3)16; and iii) not present an injury, such as partial or total rupture of ligaments, tendonitis, and/or tendinopathies in the previous six months. All participants were familiar with the vertical jump movements from their routine training. The study was approved by the local Ethics Committee (registration number: 65,231,522.0.00005020) and was conducted following the ethical recommendations from the Declaration of Helsinki, all participants were informed of the study objectives and provided their consent to participate.
The sample was previously calculated based on a pilot study that presented a minimum coefficient of determination of 0.50 (50 %), effect size |ρ|=0.70, α err prob=0.05, and power (1-β err prob) = 0.80, between the 2D measurement and the My Jump® 2 app.
Study design and proceduresParticipants were randomly subjected to four tests on a sandy surface: CMJ; squat jump (SJ); attack jump (AJ); block jump (BJ). The vertical jump height was the only variable analyzed. The athletes were encouraged to jump as high as possible in all the vertical jump tests. The data reliability was verified from two assessments (test-retest) of the My Jump® 2 app, with a 48 h interval. For the validity, the My Jump® 2 app measures were compared with measures obtained from two-dimensional kinematic analysis (considered the gold standard) .1 Before the assessments, the participants performed a familiarization with all the vertical jumps. Prior to performing the jump tests, participants underwent a five-minute warm-up, performing exercises involving lateral movements to the right and left, forward and backward, three series of 10 hops on the ground, and five submaximal countermovement vertical jumps. The research was conducted in a sand sports arena, this way a sand pit was developed to standardize and control the jumping surface, which was positioned on a rigid and level surface.
Sandbox and granulometric analysisThe jumps were executed in a sandbox with dimensions of 1.75 m in length, 1.50 m in width, and 0.40 m in height, as shown in Fig. 1. The dimensions used are larger than those used in previous studies11,17 and were established this way to better accommodate participants during the vertical jump and ensure safety during landings. The edges of the box were insulated with safe materials, using carpets and synthetic foam made of a high-tech blend of Ethylene, Vinyl, and Acetate (EVA) to protect participants from potential landing accidents. Additionally, a plastic tarp was placed underneath the wooden box to isolate the surrounding area. One week before use, the sand was air-dried and then sifted three times to remove possible debris, ensuring participant safety. The total amount of sand needed to fill the wooden box was approximately 494.790 kg, Fig. 1. As the jumps were performed, the sand in the box was disturbed by the landings, so was leveled after each jump, using a rake with an aluminum handle and a base of 0.80 cm, made of medium-density fiberboard (MDF).

To determine the mean diameter of the sand particles, granulometric analysis was conducted with 4 samples: L1, M2, K3, and R4, each weighing approximately 190.90 g, using a digital scale. After oven drying, the samples were mechanically shaken through 6 stainless steel sieves with openings of 0.600 mm, 0.250 mm, 0.125 mm, 0.063 mm, and 0.045 mm. The absolute density was calculated to be 1235 Kg/m³, classifying the sand as fine and dry. The highest concentration was found in the 0.125 mm sieve. The mean diameter of the particles was calculated using the average of the sieve openings, resulting in a mean diameter of 0.1875 mm, confirming the classification of the sand as fine (0.06 mm to 0.2 mm).
Countermovement jump (CMJ) testTo perform the CMJ, the athlete started from a static standing position, with hands on their waist, before executing a countermovement, which consisted of a downward acceleration, flexing the knees until close to 90°. During the jump, the athlete kept their torso in a vertical position, jumping at the highest speed and height possible. At the end of the movement, the participant landed on the ground with their toes.18
Squat jump (SJ) testParticipants performed the SJ from a semi-squatting position, with a knee angle close to 90° and their hands on their waist. After three seconds in this position, the athlete performed the jump (ascending phase), without countermovement, keeping their knees fully extended (180° angle) in the flight phase until landing on the ground, initially on their toes.19
Attack jump (AJ) testParticipants performed the attack jump from a semi-squatting position, knees flexed at 90°, and with their hands behind their torso during the descending phase. After three seconds in this position, the athlete performed the upward movement by extending the hip and knee. From this movement, still in the flight phase, the participant raised the dominant upper limb above the head, then performed an internal rotation of the shoulder followed by its extension, simultaneously extending the elbow, simulating the performance of the movement of a volleyball attack.20 To finish the movement, the participant landed on the ground, initially on their toes.
Block jump (BJ) testIn this test, participants adopted a semi-squatted position, with their knees flexed at 90° and their hands in front of their head. After three seconds in this position, the athlete performed the upward movement, extending the hip and knee joints, in addition to extending the arms above the head, simulating a volleyball block.20 To finish the movement, the participant landed on the ground, initially on their toes.
In all vertical jump tests, the My Jump® 2 app was used to identify the jump height. The application was installed on an Apple mobile device model Iphone 8 Plus with a 5.5-inch screen, a resolution of 1920 × 1080 pixels, 4 K footage, and a frequency of 60 Hz. Previously, the measurement of the lower limb was taken in the lying position, between the greater trochanter of the femur and the hallux, with the ankle extended. Likewise, the squatting height was taken with the subject in the squatting position with the knee flexed at 70°. Both measures followed the recommendations of the application developer.
Two-dimensional kinematic analysis was used to measure jump height in Kinovea software (version 0.9.5, Joan Charmant, Boston, MA, USA). Pueo et al.17 reported that Kinovea is a valid and reproducible tool for assessing vertical jump height, presenting ICC = 0.985; smallest worthwhile change (SWC) = 1.34; and typical error of measurement (SEM) = 0.81 cm; which makes this method sensitive for monitoring variations in jump performance. Initially, the height from the tibial tuberosity to the floor was measured for each participant,21 then a reflective marker was pasted over the anatomical point to identify the vertical displacement. The marker tracking was performed to identify the vertical displacement from the standing position to the highest jump height. The movement space was calibrated using a 0.50 m calibrator in the shape of the letter L. All jumps were filmed with an Apple mobile device (Iphone 8 plus) with a 60fps filming setting. With the aid of a tripod, the mobile device was positioned vertically at a height of 99 cm, with a distance from the edge of the sandbox to the tripod of 161 cm.
Statistical analysisThe normality of the data was verified using the Shapiro-Wilk test. All jump height scores were analyzed using descriptive statistics: mean, standard deviation (SD), and coefficient of variation (CV). Relative reliability was assessed using the Intraclass Correlation Coefficient (ICC), specifically the ICC (2,1) model for absolute agreement, with 95 % confidence intervals. ICC values were interpreted as: <0.50 = poor, 0.50–0.75 = moderate, 0.75–0.90 = good, and >0.90 = excellent reliability.22 Absolute reliability was assessed using: Standard Error of Measurement (SEM), calculated as SEM = SD × √(1 − ICC); Minimal Detectable Change at 95 % confidence (MDC95), calculated as MDC95 = SEM × 1.96 × √2. Concurrent validity was assessed by: Pearson’s correlation coefficient (r), with 95 % confidence intervals, to evaluate linear association; Lin’s Concordance Correlation Coefficient (CCC), to evaluate both precision and accuracy. Agreement analysis was performed using: Bland-Altman plots with mean bias and 95 % limits of agreement (LoA = bias ± 1.96 × SD), including confidence intervals. Evaluation of heteroscedasticity through visual inspection and correlation between differences and means- Linear regression analyses were conducted to identify proportional bias and compute the Standard Error of Estimate (SEE). A priori benchmarks for acceptable validity were defined as: bias within ±2 cm, LoA within ±5 cm, CCC ≥ 0.95, SEM <5 % of the mean, and MDC95 ≤ 3 cm. All analyses were performed using SPSS and GraphPad Prism (version 8.0), and additional statistics were calculated using R (version 4.3.0).
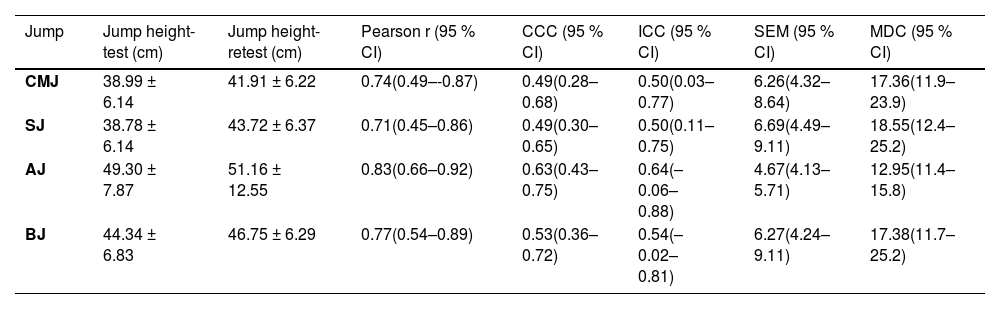
ResultsTable 1 presents the reliability results (ICC (2,1), SEM, and MDC95) for each jump type. Good relative reliability was observed (ICC = 0.447 to 0.594). However, absolute reliability metrics showed notable measurement error (SEM = 4.68–8.39 cm; MDC95 = 12.98–23.24 cm), indicating limitations in precision. Pearson correlation data indicated high linear associations between methods (r = 0.713–0.832), but CCC values were considerably lower (0.490–0.632), revealing modest agreement. These results highlight that correlation alone is insufficient to claim validity.
Agreement and reliability measures between My Jump and 2D criterion method.
Note: CMJ = Countermovement Jump, AJ = Attack jump, BJ = Block jump, SJ = Squat Jump. CI = Confidence Interval, CCC = Concordance Correlation Coefficient, ICC = Intraclass Correlation Coefficient, SEM = Standard Error of Measurement, MDC = Minimal Detectable Change.
Fig. 2 presents the analysis of the Bland Altman graph. For the height of the attacking and blocking jumps, there was a tendency for the My Jump® 2 app to overestimate the results, by 5.77 cm and 6.91 cm, respectively. A similar tendency was observed in the CMJ, with a bias of 6.24 cm, and in the SJ, with a bias of 5.38 cm.
Discussion analysis. A: CMJ; B: SJ; C: AJ; D: BJ.")
The objective of the present study was to investigate the validity and reliability of the My Jump® 2 app for measuring jump height on a sand surface. Although high Pearson correlations were observed, Lin’s CCC revealed only moderate concordance. Furthermore, the Bland-Altman analysis showed a consistent overestimation ranging from 5 to 7 cm across all jump types. SEM and MDC values were above expected thresholds, reinforcing that although the app is reliable, its absolute validity on sand is limited. The error magnitude must be acknowledged in practical applications.
Reliability data are measured through repeated trials of the same measurements. The present study used the jump height metric in four different types of jumps on a sand surface with beach volleyball players, and observed good and excellent reliability (ICC = 0.82 to 0.94). Previous studies5,6,10 observed higher ICC values, which ranged from 0.96 to 0.99; however, in all those studies, the vertical jumps were performed on a rigid surface. Our lower ICC values may have occurred due to the difficulty that the App My Jump® 2 application presents in identifying the moments of take-off and landing when applied on a sand surface. To date, only one study has investigated the validity and reproducibility of the My Jump® 2 app on a sand surface,11 however the authors only tested the CMJ with female beach volleyball athletes, while in the present study four types of vertical jumps were tested. The authors found a slightly higher ICC value than that observed in our study for the CMJ (0.92 × 0.83, respectively). Furthermore, the CV observed in the study by Medeiros et al.11 was very close to that found in the present study for the CMJ (3.5 × 3.8 %, respectively).
Furthermore, the present study showed that for absolute reliability, the SEM ranged from 4.68 to 8.39 cm and the MDC from 12.98 to 23.24 cm, indicating limitations in the accuracy of My Jump. Medeiros et al.11 observed lower SEM and MDC (1.18 and 3.27 respectively) for the height of the CMJ performed on the sand, demonstrating excellent agreement between the My Jump measurements.
To test the validity of the My Jump® 2 app on a sand surface, the data obtained in the 2D kinematic analysis was used as a reference. The Pearson correlation of jump height between the two methods showed very large correlations for all types of vertical jumps (CMJ: r = 0.73; SJ: r = 0.71; AJ: r = 0.81; and BJ: r = 0.77; Table 1). Our results are similar to those of Medeiros et al. ,11 who observed a value of r = 0.74 for the CMJ height measured on a sand surface using the My Jump® 2 app and a force platform. Previous studies that used a rigid surface observed higher values for the relationship between vertical jump height measured by the My Jump® 2 app and other devices, such as a force platform4,6 and photocell system.8 Therefore, the surface on which the vertical jump is performed appears to be an influencing factor in the relationship between the height obtained by the My Jump® 2 app and other devices. However, the CCC values were considerably lower (0.490–0.632), revealing modest agreement between My Jump and kinematic analysis. These results highlight that correlation alone is insufficient to claim validity.
In general, the Bland–Altman plots (Fig. 2) showed high biases for all vertical jump conditions tested, that is, the vertical jump height when measured with the My Jump® 2 is overestimated compared to 2D kinematic analysis (CMJ = −6.91 cm; SJ = −5.08 cm; AJ = −6.25 cm; BJ = −5,37 cm). This difference is significant, and it demonstrates that My Jump may not be accurate in measuring vertical jump height on sand in its current form. Compared to previous studies, our observed error is larger. Recently, Medeiros et al.11 found a mean difference in CMJ height between the My Jump® 2 app and the force platform of only 0.32 cm. Studies that performed the CMJ on a rigid surface also observed biases considered low, 1.1 cm5 and −0.09 cm,7 when comparing the height obtained via the My Jump® 2 app with a force platform and contact mat, respectively. In the current study, the app overestimated the jump height compared to the gold standard (2D Kinematic), which was also observed in other studies. We could speculate that this difference is based on the difficulty the My Jump® 2 app has to identify the exact moment of push off and landing of foot contact when performed on sand. Furthermore, during 2D kinematic analysis, the reference point is higher (tibial tuberosity) than the reference point in the My Jump® 2 app (tiptoes, hallux).
Finally, some limitations should be considered, the low resolution used in the My Jump 2 app (60fps). Furthermore, for sand dissipation during take-off can potentially extend the flight time, because the athletes can executing take-offs on a higher surface level compared to their landing. We did not present cross-validation in this study, so future studies could use split-sample validation or a second cohort to verify whether the observed bias remains stable. We also suggest the exploration of correction factors for My Jump 2 on sand. However, this investigation has strong points; this was the first study to investigate the validity and reliability of the My Jump® 2 app for different types of vertical jumps on a sandy surface.
ConclusionWe concluded that while the My Jump® 2 app demonstrated good test-retest reliability, its absolute agreement with 2D video analysis on sand surfaces was limited. The observed biases (5–7 cm) and low CCC values suggest that the app tends to overestimate jump height under these conditions. Thus, although useful for consistent monitoring, its accuracy on sand should be interpreted with caution. Calibration or correction procedures may be required for precise measurements in sandy environments.
In summary, the My Jump® 2 app is a reliable and valid tool for assessing vertical jump height on sand surfaces. While it tends to slightly overestimate jump heights, the high correlations with 2D kinematic analysis support its use for consistent and practical performance assessments in various training contexts.
Declaration of fundingWe would like to thank the Fundação de Amparo à Pesquisa do Estado do Amazonas (FAPEAM), and the Coordenação de Aperfeiçoamento de Pessoal de Nível Superior (CAPES), for providing support for the Programa de Pós-Graduação em Ciências do Movimento Humano (grant 001).
No interests to declare

