


Injuries in professional basketball affect player performance and generate significant costs. This study analyzed the incidence and economic impact of 102 injuries in a team from the ACB League over four seasons, with an injury rate of 5.85 injuries per 1,000 hours, higher during games. Muscle injuries (42 %), mainly involving hamstrings and the Achilles tendon, were the most common. Although 68.6 % were minor (1-7 days), severe injuries (>28 days) accounted for the highest economic burden. Single-competition seasons exhibited a higher budgetary impact (6.5 %) compared to dual-competition seasons (4.5 %).
The findings highlight the importance of preventive programs tailored to the competitive demands and player characteristics.
Professional basketball, one of the most physically demanding sports, poses a high risk of injuries that affect player performance, team results, and associated costs.2 Factors such as competitive load, a tight schedule, and individual player characteristics are key determinants in the incidence and severity of these injuries.8 While the NBA has extensively studied game congestion and other risk factors7, the European ACB League, despite its competitive level, remains under-researched.
Previous studies associate high and low training loads with an increased risk of injuries, especially in highly demanding competitive seasons.4,14 However, the literature on European basketball is still limited compared to other leagues, leaving a significant gap in understanding how these dynamics affect high-level teams.7,11
This study examines the incidence and economic impact of injuries in an ACB League team over four consecutive seasons, assessing how differences between single-competition and dual-competition seasons influence injury patterns and associated costs, aiming to provide data to improve injury prevention and management.
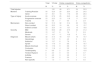
MethodologyA descriptive observational study was conducted over four consecutive seasons (2020-2024) with a Spanish ACB League team competing in one or two competitions (ACB and/or FIBA Champions League). A total of 33 players participated, with details of age, height, and weight presented in Table 1.
General description of participants by age, height, and weight, categorized by season and competition type.
Player Distribution: n=4 participated in all four seasons.
- •
n = 3 participated in three seasons.
- •
n =3 participated in two seasons.
- •
n = 22 participated in one season only.
All procedures were approved by the Ethics Committee of the University of Vic (024/2021) following the Declaration of Helsinki. Informed consent was obtained from all participants.
Data included injuries, games, training sessions, and salaries, collected from the club's medical records and supplemented with salary information based on.6,15 Injuries were classified according to OSICS v10.1, following international guidelines.1,12 Definitions of "time-loss injury" (TLI) and "return to play" (RTP) were based on UEFA standards.9 Variables related to injury epidemiology used in the study are defined in Table 2.
Definitions of injury epidemiology variables used in the study.
| Injuries | |
|---|---|
| Injuries | Total number of injuries per player. |
| Diagnose | Classification of injuries into categories such as muscular, joint-related, tendinous, among others. |
| Affected Area | Parts of the body affected, identified as knee, ankle, shoulder, etc. |
| Type | Categorized by their cause and progression: acute overuse results from excessive or repetitive strain over a short period, progressive overuse develops gradually from chronic strain, and trauma occurs suddenly due to external forces or impacts. |
| Severity | Classification of injuries as mild (1–7 days), moderate (8–28 days), or severe (>28 days), following the classification proposed by van Mechelen et al.17. |
| Injury Costs | |
|---|---|
| Indirect Cost | Indirect costs derived from lost activity days, calculated using the formula by Ekstrand et al.9: Indirect Cost per Injury = (Annual Salary / Total Activity Days) × Days Lost. |
| Cost per Incidence | Estimated cost per incidence of injury per 1,000 hours of exposure, linking injury frequency with its indirect economic impact. |
The statistical analysis employed a robust methodology to evaluate injury data comprehensively. Absolute and relative frequencies were used for qualitative variables, while measures of central tendency and dispersion provided insights into quantitative variables. Key metrics such as incidence rates (IR) and injury burden (IB) were calculated per 1,000 hours of exposure, allowing for a detailed breakdown by injury type, severity, anatomical location, age group, and player position. Confidence intervals (95 % CI) were determined using a Poisson distribution to ensure the precision of estimates. All analyses were conducted with SPSS v21 and R v3.4, ensuring accurate and reliable results.
ResultsA total of 102 injuries were recorded among 33 players over four seasons, with an average of 25.5 injuries per season and an incidence rate (IR) of 5.63 injuries per 1,000 hours (95 % CI: 3.45–7.82) (Table 3). The incidence rate was significantly higher during games (122.28/1,000 hours) compared to training sessions (3.05/1,000 hours). Single-competition (SC) seasons exhibited higher injury rates (9.86/1,000 hours) compared to dual-competition (DC) seasons (5.73/1,000 hours) (Supplementary Tables S2 and S3).
Total injury frequencies and severity by competition type (DC vs. SC).
Non-contact injuries were the most frequent, with minor injuries (1-7 days) comprising 68.6 % of all cases. However, severe injuries (>28 days), though less common (16.7 %), resulted in a cumulative loss of 891 days of player activity. SC seasons showed a higher prevalence of acute injuries (43.1 %) compared to DC seasons (Table 3).
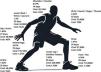
Injury types and anatomical distributionMuscle injuries accounted for 42 % of all cases, primarily affecting the hamstrings and Achilles tendon, followed by joint (14.7 %) and ligament injuries (10.7 %) (Supplementary Table S5). The lower leg was the most frequently affected area, with an injury burden (IB) of 18.61 days/1,000 hours (95 % CI: 16.62–20.59), followed by the hamstrings (11.26 days/1,000 hours) and the knee (4.31 days/1,000 hours).
Incidence by position and ageGuards had the highest incidence rate (1.60 injuries/1,000 hours), while centers had the lowest (0.94/1,000 hours) (Supplementary Table S7). Players aged 23-28 years experienced the highest number of injuries, accounting for 58.82 % of cases. However, players over 35 years had the highest player-to-injury ratio (2.75), reflecting a reduced recovery capacity and increased prevalence of chronic injuries. (Supplementary Table S8).
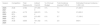
Economic impact of injuriesThe total indirect cost of injuries amounted to €843,000, equivalent to 7.03 % of the average annual budget. Single-competition (SC) seasons had a higher relative impact (6.5 %) compared to dual-competition (DC) seasons (4.5 %). Salary costs for lost days decreased from 9.43 % in the 2020-2021 season to 4.44 % in the 2023-2024 season, reflecting improvements in injury management (Table 4).
Economic impact of injuries.
Achilles tendon injuries were the most expensive (€228,900), followed by foot injuries (€172,800) (Table 5). For a detailed breakdown of the economic impact by body region, see Supplementary Table S9, which highlights that Achilles tendon injuries accounted for 7.63 % of the total cost. Similarly, Supplementary Table S10 demonstrates how inactivity days influenced the percentage of salary costs per player, showing a progressive decline from 2020 to 2024.
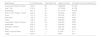
Injury costs by body region.
Fig. 1 graphically represents the distribution of injury costs by body region, providing a clear overview of the economic impact associated with different types of injuries.
Discussion
This study confirms that while exposure time in training sessions results in a higher overall injury incidence, games exhibit significantly higher rates when adjusted for exposure hours (122.28 vs. 3.05 injuries/1,000 hours). These findings align with previous research highlighting the competitive intensity and increased contact risk during games as key factors (4; Crespo et al., 2021).
Single-competition (SC) seasons demonstrated a higher incidence rate (9.86 injuries/1,000 hours) than dual-competition (DC) seasons (5.73 injuries/1,000 hours). This difference is likely due to the increased focus on intensive training in SC seasons, compared to the more frequent recovery periods facilitated by DC schedules.14
From a game position perspective, guards experienced the highest injury incidence (1.60 injuries/1,000 hours), reflecting the physical demands of their role, including explosive movements and rapid directional changes. These findings corroborate studies linking dynamic positions with elevated injury risks.10 Conversely, centers showed the lowest incidence (0.94/1,000 hours), likely due to reduced exposure to high-velocity movements.
Players aged 23-28 accounted for the majority of injuries (58.82 %), consistent with their being the largest group in the sample. However, older players (>35 years) had the highest player-to-injury ratio (2.75), highlighting their diminished recovery capacity and prevalence of chronic injuries, as seen in prior studies.5,16
Muscle injuries (42 %), particularly in the hamstrings and Achilles tendon, were the most common and costly. This underscores the need for specific preventive programs targeting these vulnerable areas.3,9 Although 68.6 % of injuries were mild, severe injuries (>28 days) accounted for the greatest economic and temporal burden, with 891 days lost across four seasons. This finding highlights the critical importance of reducing the severity of injuries, not just their incidence (Tables S8 and S9).
Economically, Achilles tendon and hamstring injuries posed the greatest financial burden, with combined costs exceeding €339,000. Moreover, SC seasons had a relatively greater impact on annual budgets (6.5 %) compared to DC seasons (4.5 %), attributable to increased training loads (Tables S9 and S10). These results align with existing literature emphasizing the disproportionate cost of severe injuries in both time and financial resources.13,16
ConclusionThis study demonstrates that injuries in professional basketball are more frequent during games and have a higher incidence in single-competition (SC) seasons, likely due to increased training loads. In contrast, dual-competition (DC) seasons showed lower injury rates, potentially due to more structured recovery periods. Muscle injuries, particularly in the hamstrings and Achilles tendon, were the most common and costly, while severe injuries (>28 days), though less frequent, had the greatest economic and time-loss impact.
These findings underscore the critical need for preventive programs tailored to mitigate both the incidence and severity of injuries, especially in high-risk areas. Adjustments to training and recovery protocols should be prioritized to optimize player performance and reduce the associated economic burden.
Future research should focus on evaluating the effectiveness of tailored preventive programs that adjust training loads and recovery strategies based on competitive formats. Additionally, exploring the influence of factors such as player position, age, and injury history on injury patterns would provide a more comprehensive understanding. Expanding the analysis to include multiple teams could enhance the generalizability of the findings and contribute to the development of league-wide injury prevention strategies.
LimitationsThis study presents some limitations, primarily the sample size, as it focuses on a single professional team, which may limit the generalization of the results to other competitive contexts. Additionally, while four seasons were analyzed, differences in schedules and specific conditions of each year could have influenced the findings. Finally, data on variables such as players' prior injury history or external factors, such as changes in training intensity, were not included, which could have provided greater depth to the analysis.
FundingThe author, A.R, received funding to conduct this study from the Industrial Doctorate Plan from the Government of Catalonia, under the grant: [2020/DI/00056]. The funders had no role in the study design, the data collection and analyses, in the decision to publish, or in the manuscript preparation.
This study is part of an industrial doctorate program funded by the Generalitat of Catalunya and conducted in collaboration between the University of Vic – Central University of Catalonia (UVic-UCC) and Bàsquet Manresa, a professional basketball club. The principal investigator is employed as the team's lead performance coach. The employment context facilitated data collection and analysis. However, the study design, interpretation, and conclusions were carried out independently and were not influenced by the funding entities or the club. The authors declare no additional conflicts of interest.