

The main aim of this descriptive study was to analyze the situations in which goalkeepers find themselves when receiving shots, in order to design more specific training methods.
MethodA total of 2238 shots have been analyzed in 15 goalkeepers belonging to 10 different teams, from 179 matches during the 2019–2020 La Liga season (First Spanish Football Division).The study was divided by two parts. In the first one, all data was analyzed with no grouping, and the second was divided in 4 groups based on final team position when the competition was finished (Top, Middle High, Middle Low and Bottom).
ResultsFrom all the shots obtained, information has been analyzed on: temporality, the most repeated actions by the strikers and goalkeepers, separating the actions by different situations (direction, number of contacts, game situation, cross…), and the areas of the field in which the actions occur.
Conclusions1) First touch shots were the most dangerous given that the difficulty for defenders and goalkeepers to block and stop respectively; 2) The high percentage of deflected shots (17.6%) shows the importance of training them as they are difficult situations to analyze; 3) the more time the shooter spends preparing the shot, the more accurate it will be, but the more effective the goalkeeper's action will also be; 4) Top teams use less set pieces and crosses, and they use to make more touches than the other groups to finish the plays.
The role of the goalkeeper (GK) is the most specific in football, since he is the player who can have the greatest impact on the final result of a match, given that this player has in his hands the possibility of disabling the attempts of the opponents by performing actions of great risk to do so. A mistake can change the development of the match, being a position that carries a great responsibility,1 and because of that, they must remain alert during the periods when they are not directly involved in the game.2
Such a role requires a specific type of training with respect to that of the outfield players, given that they must master both, the technique with their feet and their hands, being their participation in the game very different from that of the rest of the outfield players.3
Besides, the GK needs a great technical ability to perform actions of great difficulty such as accurate long-distance passes, saves to close shots with feet and hands, handling fast balls and clearing aerial balls with the fists.4
In particular, in defensive situations, especially those in which the goalkeeper must protect the goal (shooting, one-on-one with opponents and crosses), the GKs actions are usually of a very explosive nature, short in duration and technically complex, and agility is essential. Specifically, Shepard and Young5 described agility as a quick movement of the whole body where there is a change of speed and/or direction due to a stimulus, so within the context of the football GK, the ability to react quickly, specific neuromuscular aspects and the ability to perform powerful movements must be considered.6
During the course of the game, the GK must develop various roles both offensively and defensively. To defend a goal situation, the goalkeeper uses a sequence of three phases: positioning, body activation and defense. Through positioning, the GK positions himself in the area of the field that will help him to succeed before or during the opponent's action (it is a very intuitive ability). Thanks to the body activation the movements to be performed will be executed at a higher speed, for this he must have both feet on the ground during the possible shot. Finally, in defense he will have to see the direction of the ball and react in a very short period of time with the most appropriate technical action for each situation.7
Scoring goals is what determines success in football, therefore, several authors have analyzed shots and goals.8-11 After reviewing the existing scientific literature on finishing in football, it was found that different analyses had been conducted on the subject, such as the works of Brito de Souza et al.12 and Liu et al.13 comparing the finishing of successful and unsuccessful La Liga teams, the work of Kubayi14 analyzing the pattern of goal scoring in the 2018 FIFA World Cup, or the research of Li and Zhao15 in which they analyze the pattern of goal scoring among the 5 major European leagues (La Liga, Premier League, Ligue 1, Bundesliga and Serie A) between the 2009–2010 and 2018–2019 seasons, but no work has been found focused on analyzing the previous situation and the GK's response to finishing actions, for the best of the author´s knowledge.
Taking into account the transcendence of the goal in this sport, and therefore the importance of not getting scored on, the main aim of this research will be to know what kind of situations they face most frequently and how they are generated, in order to be able to design more specific training methods.
We are taking steps forward in the study of goalkeeper training by identifying training methods4 and analyzing the skill acquisition,16 and we believe that knowing the situations faced by goalkeepers in competition can be of great help in designing both periodizations and sessions.
MethodsIn this descriptive and retrospective research, 2238 shots in which 15 GKs belonging to 10 different teams participated in 179 matches of the 2019–2020 La Liga (Spanish First League) season were analyzed. The lack of studies developed with this objective has led us to select the variables under study from the consensus among several professional goalkeeper coaches.
Data extraction and syntesisTo obtain the information used in the statistics, all the shots analyzed in the study were visualized carefully (M.P-A, J.Z-L and A.C), and the following variables were extracted from each situation: minute, body part, type of shot, shot mode, GK action, save, goal, touch, clearance, cross, consequence, bounce, dynamic, contacts and finishing zone and distance reduction. To extract the aforementioned information, all the matches were visualized at a higher speed than the original one (M.P-A, J.Z-L and A.C), and each time a shot was made, it was reproduced at normal speed as many times as necessary to obtain all the variables. As we obtained the information, we dumped it into an Excel spreadsheet (M.P-A and A.Z), and once the data collection process was completed, we began to analyze the data (M.P-A, J.C-G and A.Z).
In the first part of the study, all data are analyzed without any specific grouping, in order to obtain general information about the league. In the second part we divided the teams into 4 groups depending on the final position they obtained at the end of the competition. The groups were formed by the first five classified as top (T), the next five as middle-high (MH), the next five as mid-low (ML) and the last five as bottom (B). We considered different grouping options, but this seemed to be the most appropriate. All the results are given with absolute (N) and relative information (%). Interobserver reliability was calculated using Cohen's Kappa, obtaining values greater than 0.84 and p<0.05 for all variables used in this study.
Statistical analysisDue to the type of variables recorded (Table 1) and in accordance with the objectives of this study, we have opted first to carry out a descriptive analysis in Part l, using frequencies and relative frequencies (%).
Variables extracted from every analyzed situation.
GK=goalkeeper.
To follow Part l, the relationships established among the variables used are analyzed by applying a contingency table analysis. The relationship among the variables is measured using Pearson's chi-square coefficient and the level of significance has been set at p<0.05. The effect size was calculated using Cramer's V coefficient, establishing the levels trivial (V<0.1), small (V >0.1 and <0.3), medium (V>0.3 and <0.5) and large (V>0.5) .17
To make the Part ll, we opted to keep analyzing the data with contingency tables, measuring the relationship between the variables using Pearson's chi-square and calculating effect size using Cramer's V coefficient. The JASP statistical package version 0.16.3 was used for the statistical analysis.
ResultsPart lWhen analyzing the time distribution of the shots, the 17.3% (387) of them were taken between 46–60 minutes of playing time, 17% (381) between 76–90 minutes, 16% (359) between 16–30 and 61–75 minutes, 14.9% (333) between 31–45 minutes, 14% (313) between 0–15 minutes and 4.8% (107) in the extension of the second half.
Related to goals, the 19% (48) were scored between minutes 46–60, 16.2% (41) between minutes 0–15, 31–45 and 61–75, 15.4% (39) between minutes 76–90, 11.9% (30) between minutes 16–30 and 5.1% (13) in the extension of the second half.
After all shots analyzed, only the 11.3% (253) were goals, of which 72.7% (184) were first touch, 11.5% (29) in two contacts and 15.8% (40) in more than two contacts. Of the first touch goals, 33.7% (62) were shots to the natural side, 33.2% (61) were cross-shots, 29.9% (55) were centered shots and 3.3% (6) were deflected shots. For goals with two contacts, 51.7% (15) were cross-shots, 34.5% (10) were shots to the natural side, 10.3% (3) were centered shots, and 3.4% (1) were deflected shots. In goals with more than two contacts, 42.5% (17) were shots to the natural side, 35% (14) were cross-shots, 20% (8) were centered and 2.5% (1) were deflected shots. These relationships were not significant (p=0.271) and present a small effect size (V= 0.127).
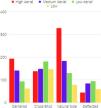
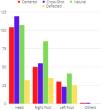
The most repeated shots (Fig. 1) by the attackers are the natural side shot (32.4%, N=725), the cross-shot (28%, N=626), the center shot (22.1%, N=494) and finally the shots that are deflected by a defender (17.6%, N=393). Taking into account the height at which the shot reaches the goal, the most common was the high aerial shot (31.4%, N=703), followed by the medium aerial shot (24.8% N=556), the low aerial shot (22.3%, N=498) and the low shot (15.5%, N=346). When the shot is executed to the natural side 45.6% (328) of the occasions it reaches the goal as a high aerial shot, 25.5% (183) as medium aerial, 18.1% (130) as low aerial and 10.8% (78) as low, and when the shot is executed to the cross side 29, 5% (181) presents a low aerial shot, 24.1% (148) is a medium aerial shot, 23.9% (147) a low shot and 22.5% (138) a high aerial shot, this relationship being significant (p = 0.000), and the effect size small (V= 0.296). After each attacking action, the defending team gained possession of the ball 75.1% of the time.

The most repeated action by GKs is not reacting to the action of the opposing team's attacker (55.8%), both, given that the shot does not reach the goal and there is no need for a reaction (92.8%), and because the GK has not reacted to a shot that ends up being a goal (7.2%). Besides, when analyzing the actions in which there is a reaction by the GK, it can be observed that the clearance with one hand is the most repeated (15.3% N=343), followed by the handling (14.5% N=325), the clearance with two hands (8.1% N=182), the clearance with the feet (4.4% N=99) and the clearance with the body (1.7% N=38).
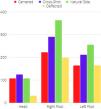
Of all the shots analyzed (Fig. 2), 47.9% (1073) were executed with the right foot, 35.5% (794) with the left foot and 16.5% (369) with the head. 33.8% (363) of the shots with the right foot were executed to the natural side, 27% (290) were cross-shots and 20.7% (222) were center shots. With the left foot, 32.1% (255) are shots to the natural side, 26.6% (211) are cross-shots and 20.7% (164) are centered shots. In the case of headers, 33.6% (124) are cross-shots, and 29% (107) are natural side and centered shots. In the case of deflected shots, 20.7% (164) of the shots with the left foot, 18.5% (198) of the shots with the right foot and 8.4% (31) of the shots with the head are deflected. These relationships are significant (p=0.000) and has a trivial effect size (V= 0.094).

GKs reacted to right-footed shots by clearing the shot with one hand 15.8% (170) of the time, handling it 12.5% (134) of the time, clearing it with both hands 8.4% (90) of the time, and clearing it with their foot 5% (54) of the time. In the case of left-footed shots, 16% (127) of the occasions the GKs reacted by blocking handling the shot, 14.6% (116) by clearing it with one hand, 8.4% (67) by clearing it with two hands and 5.5% (44) by clearing it with the foot. Finally, 17.1% (63) of headers were handled, 15.4% (57) cleared with one hand and 6.8% (25) cleared with two hands. In 59.6% (220) of the headers, 56.5% (606) of the right-footed headers and 53.1% (422) of the left-footed headers there was no GK action. These relationships are significant (p=0.030) and the effect size is trivial (V= 0.082).
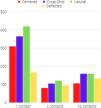
Taking into account the number of contacts made by the attacker to shot (Fig. 3), when shooting with the first touch, 33.3% (419) of the shots were to the natural side, 28.9% (364) were cross-shots, 24.6% (309) were centered shots and 13.2% (166) were deflections. When two contacts are used, 30.2% (120) are shots to the natural side, 26.1% (104) are cross-shots, 23.6% (94) are deflected shots and 20.1% (80) are centered shots. When the attacker chooses to make more than two contacts, 32% (186) of the shots are to the natural side, 27.1% (158) are cross-shots, 22.9% (133) are deflected shots and 18% (105) are centered shots. These relationships are significant (p=0.000) and have a trivial effect size (V= 0.097).

When analyzing the GKs responses to the different shots depending on the number of contacts made, in the first touch shots the most common responses are the one-handed clearance (15.7%, N=198), the blocking (13.2%, N=166), the two-handed clearance (7.6%, N=95), the clearance with the feet (4.6%, N=58) and the clearance with the body (1.5%, N=19), the GK remaining in 57.3% (721) of the shots without performing any action, of which 10.8% (78) were goals. In the two-contact shots, the most repeated actions were the one-handed clearance (12.8% N=51), the block (12.1% N=48), the two-handed clearance (7.8% N=31), the clearance with the feet (5.3% N=21) and the clearance with the body (2.8% N=11), with the GK remaining in 59% (235) of the shots without performing any action, of which 2.6% (6) were goals. With shots with more than 2 contacts, the most repeated actions were blocking (19.1%, N=111), clearing with one hand (16.2%, N=94), clearing with two hands (9.6% N=56), clearing with the feet (3.4%, N=20) and clearing with the body (1.4%, N=8), with the GK remaining in 50.3% (293) of the shots without performing any action, of which 2% (6) were goals. These relationships are not significant (p=0.080) and have a trivial effect size (Cramer's V = 0.078).
When analyzing the shots preceded by a cross (Fig. 4), 57% (357) came from a dynamic game situation, 29.9% (187) from a corner kick, 10.4% (65) from a lateral free kick, 2.1% (13) from a frontal free kick and 0.6% (4) from a throw-in. 90.4% (637) were taken with one touch, 8.1% (57) with two contacts and 1.6% (11) with more than two contacts. 70.3% (478) reach the goal without bouncing on the trajectory, while 29.9% (202) do. The surfaces used to finish these crosses were the head 50.9% (359) of the time, the right foot 31.9% (225) of the time, the left foot 16.9% (119) and other surfaces 0.3% (2) of the time. Of the shots with the head, 33.1% (119) were crosses, 29.8% (107) to the natural side, 29% (104) centered and 8.9% (32) deflected by a defender. With the right foot, 37.8% (85) of the shots were to the natural side, 24.4% (55) were crosses, 22.2% (50) were centered and 15.6% (35) were deflected. Of the shots with the left foot, 34.5% (41) were to the natural side, 25.2% (30) were centered, 21% (25) were deflected and 19.3% (23) were crossed.

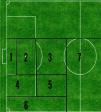
The areas of the field (Fig. 5) from which the most shots were taken were zone 2 (32.1%, N=719), zone 3 (20.6%, N=460), zone 4 (19.5%, N=436), zone 5 (12.9%, N=288) and zone 1 (7.5%, N=168). Only 1.3% (30) of the shots were penalty kicks.

When considering only the shots that resulted in a goal, the zones with the most shots are zone 2 (46.6%, N=118), zone 1 (21.3%, N=54), zone 4 (11.9%, N=30) and the penalty spot and the zone 3 (7.9%, N=20).
Continuing with the shots after a cross the most common shooting zones were zone 2 (62.6% N=441), zone 1 (18.2% N=128), zone 4 (11.1%, N=78) and zone 3 (6.5%, N=46).
Of all the shots received, the goalkeepers decided to reduce the space on 75 occasions. Of these 75 occasions, 35 (46.7%) occurred when the shot was taken in zone 2, 23 (30.7%) in zone 1 and 14 (18.7%) in zone 4.
Part llAnalyzing the number of shots made by each team, the top (T) team has been the one that has made the most with 676 shots, followed by middle-low (ML) with 571, and MH being the group that has made the fewer with 490.
When considering shots from a cross, T is the group that takes the least number of shots, taking 27.7% (N=187) of them, and bottom (B) is the group that takes the most shots in this way, taking 34.5% (N=173) of them. Group middle-high (MH) and ML make their chances in this way 33.3% (N=163) and 31.9% (N=182) respectively. These relationships are not significant (p=0.058) and have a trivial effect size (Cramer's V= 0.058).
Looking at shots that are achieved through dynamic play situations or set pieces, T is the group that generates more situations dynamically, with 91.4% (N=618) of the shots being achieved in this way. In the other way, B and ML are the groups that obtain more shots from the set pieces with 14.4% (N=72) and 13.3% (N=76) respectively. These relationships are significant (p=0.011) and have a trivial effect size (Cramer's V = 0.71).
When analyzing the number of contacts they make to shot, the T group make 51.9% (N=351) of the shots in the first touch, the MH group 58.8% (N=288), the ML group 55.9% (N=319) and the B group 59.9% (N=300). In the case of two contact actions, group B used them the most (18.8%, N=94), followed by groups T (18.2%, N=123), MH (18%, N=88) and ML (16.3%, N=93). Finally, 29.9% (N=202) of the T-group's finishes are with more than two contacts, in the case of the ML group this percentage is 27.8% (N=159), followed by 23.3% (N=114) and 21.4% (N=107) of the MH and B groups, respectively. These relationships are significant (p=0.018) and have a trivial effect size (Cramer's V = 0.058).
As a last point to be analyzed, the zones through which the different groups finish off were compared. The zone 2 is the most prolific for all groups, but in particular for T (34.9%, N=236) and B (33.5%, N=168). Zone 1 is the second most prolific location for goals, with the MH group taking the most shots in that zone (10%, N=49), with the T group taking the fewest (6.1%, N=41). The most active group in zone 4 was ML (22.4%, N=128), and the least active group was MB (17.1%, N=84). In the case of zones 3 and 5, all groups were most active in zone 3, with the most active groups being T (22.3%, N=151) and MH (21.6%, N=106), and the most active groups in zone 5 being B (13.8%, N=69) and MH (13.3%, N=65). From the farthest zone, zone 7, the MH group made 6.3% (N=31) of its attempts, ML 4.9% (N=28), B 4.8% (N=24) and T 1.2% (N=8). Finally, zone 6 was the least used for all groups, with the ML group using it the most (2.3%, N=13). These relationships are significant (p=0.023) and describe a trivial effect size (Cramer's V = 0.077).
DiscussionThe main objective of this descriptive article was to understand and analyze what amount and in what way they had to deal with different shooting situations, in order to be able to design more specific training sessions. In fact, for the best of the author's knowledge, no previous similar research have been found, what makes difficult (not possible) to compare our work with previous studies.
Among the 2238 shots analyzed in this study, only 253 (11.3%) were goals, and in 1159 (51.8%) the shot was not directed at the goal, so that the goalkeepers were able to save the shot on 826 occasions, that is, 36.9% of the total situations and 76.5% of the shots that were directed at the goal. Of all the shots, 75.1% of the time the defending team recovers possession of the ball, making it rare to be taken in the same play more than one shot. If we add to the above what Tenga et al.10 contribute in their study on the possibility of scoring after various game situations, it is important to recognize that offensive production in this sport is not very prolific and the importance of having decisive players in both areas.
It seems that the most used type of shot is the high aerial shot to the natural side, but in the case of cross-shots the balls are given less height, being the low aerial, medium aerial and low shots more probable than the high aerial ones. Another very important shot to take into account is the deflected shots, which constitute 17.6% of all shots, and which generate a great difficulty in the GKs decision making, since the direction of the shot changes halfway, making it a very important situation that must be given space in training. For the GK it is vital to react quickly, as they are faced with unpredictable stimulus and a constantly changing scenario.6
When analyzing the most repeated actions by the GKs, we see how the one-handed clearance is the most common (15.3%), followed by the handling (14.5%) and the two-handed clearance (8.1%), demonstrating the importance of an adequate use of both hands in different game situations, manual dexterity to be able to save and handle shots of all kinds,18 and the need for excellent dynamic visual acuity, as Reilly & Doran said.19
When the shot is taken with either foot, shots to the natural side are more frequent than cross-shots, and about 1 in 5 shots are deflected, 18.5% in the case of shots taken with the right foot and 20.7% in the case of shots taken with the left foot. In the case of shots with the head, it is most likely to be a cross-shot, with the same probability of being centered or to the natural side, and the possibility of being deflected in the trajectory is reduced by 8.4%. However, after analyzing the literature we have not found any solid argument to justify what we mentioned, so we believe that new studies should be done in this line.
The GKs reaction varies depending on the body part with which the shot is taken. When the shot is made with the right foot, the most repeated action is the one-handed clearance (15.8%) followed closely by handling (12.5%), as opposed to the shot with the left foot and head, where the most repeated action is handling (16% and 17.1% respectively) followed by the one-handed clearance (14.6% and 15.4% respectively). In the case of left-footed shots, the higher percentage of handling may be due to the fact that most of the shots were executed by right-footed players, reducing the difficulty of the shot for the GK. And in the case of headers it may be because in headers the ball does not reach as much speed as in shots with the feet, making it easier to block a ball that goes to the close range of the GK. The higher the level of the athlete, the better he will decide which is the best way to deal with the situation he is facing.20
Depending on the number of contacts made by the striker to shoot, differences in the result are observed. In all three cases the probability of the shot being to the natural side is the highest, followed by the cross-shot, but the differences appear when analyzing the deflected shots. As the first touch actions are the fastest, they are the most complicated for defenders to block or deflect compared to two-touch or more than two-touch shots, and it can be seen that one-touch shots are the least likely to be deflected (13.2% vs. 23.6% vs. 22.9%).
Of all the goals recorded, 72.7% were one-touch shots, of which 33.7% were to the natural side, 33.2% to the cross side and 29.9% to the center, and 10.8% of the occasions in which the goalkeeper was left without taking any action were goals, which indicates the importance of training these situations due to the difficulty they represent for GKs. These are very fast shots, which takes time away from the GK to approach the action correctly, which implies that both the percentage of total goals and the percentage of centered goals are so high. These situations should be addressed by improving agility, which in the words of Serpel et al.21 is a motor skill that should be trained explicitly and implicitly.
The GK reacts in a similar way to one and two-touch shots, with the one-handed clearance (15.7% and 12.8% respectively) and handling (13.2% and 12.1% respectively) being the most repeated actions. In the case of shots with more than two touches, the most repeated action is handling (19.1%), followed by the one-handed clearance (16.2%). If we pay attention to the percentage data in which the GK does not act and the percentage of goals in these situations, adding the data of the most repeated actions, we can see that the more time the shooter spends preparing the shot, the more accurate it will be, but the more time the goalkeeper will have to approach it properly and the more effective it will be than in faster shots such as one and two-touch shots.
Nine out of 10 crosses are finished with the first touch, and 29.9% of the shots reach the goal after at least one bounce, which makes this type of play very fast and complex to decipher. Most of the crosses come from dynamic game situations (57%), corner kicks (29.9%) and side free kicks (10.4%), so it seems of vital importance to train decision making in dynamic game situations and the understanding of set pieces. Half of the crosses (50.9%) are headed, and most of them directed to the cross side (33.1%), followed closely by directed to the natural side (29.9%) and centered (29%). When the shot is executed with the right foot (31.9%), the most common is the shot to the natural side (37.8%), followed by the cross-shot (24.4%) and centered (22.2%), but in the case of shots with the left foot (16.9%), 34.5% of the shots are directed to the natural side, followed by centered shots (25.2%) and cross-shots (19.3%). This may be due to the fact that most players are right-footed,22 and the technical movement of crossing a shot with the first touch is more complicated than sending it to the natural side, so that on many occasions when shooting with the left foot a right-footed player has made the easier decision for himself.
Most of the shots were taken from medium distance and with a centered orientation, followed by medium-long centered shots, and as the attacker gets closer to the goal there were fewer shots, demonstrating that the complexity of being able to execute a shot increases as he gets closer to the goal. When the shot was taken from a more lateral zone, it was easier to happen inside the box and not outside.
As in Rathke's work,23 the highest number of goals have been scored from zone 2, but if we compare the percentage of success of all the zones, we can see that zone 1 is more dangerous than zone 2 (32.2% vs 16.4%), so we can say that the small box is a very dangerous zone that must be strongly defended. In the case of shots from a cross, the majority are outside the small box and closer to the edge of the box and from a centered position. Only 18.1% of the shots were in zone 1, because both GKs and defenders have a great capacity for action in this zone, and this makes it more difficult for the attacker to generate a goal-scoring situation.
When comparing the way the different groups generate shots, we may observe how the teams in group T make less use of crosses and set pieces than the rest of the groups. They also take more shots from 2 and more than 2 touches than the rest of the teams. These situations may be due to the fact that the teams in group T have a greater dominance of dynamic play in most matches, and that the attacking players are more skillful so that in finishing areas, where the execution time is low, they decide to do different actions such as dribbles, cuts and feints instead of finishing with the first touch. The opposite is the case of the group B teams, who are the ones who are the most likely to finish after a cross or a set piece, and with their first touch. These teams may arrive with less control to the finishing zones, so they try to increase their chances of scoring through a more direct game, with a higher volume of crosses to dangerous zones and finishing the play as soon as possible with one-touch shots. This is in line with the results presented by Tenga et al.10 that longer passing sequences are more effective than shorter ones.
In terms of the field areas from which each group shoots the most, the teams in group T described to shoot more easily from centered areas such as zones 2 and 3, while the rest of the groups increase their percentage of shots in lateralized zones such as 4 and 5. As for very long distance shots (Zone 7), the T teams hardly try their luck from that zone (1.2%), probably because they are aware that they have better chances of getting a better goal situation by following the play and trying to reach zones closer to the goal, while the other teams try to surprise the opposing team from there with greater assiduity.
In the case of the temporality of the shots, the time in which more shots were executed were in the second half, coinciding with the work of Szwarc et al. ,24 where they stated that the GKs involvement was greater in the second half compared to the first half. Regarding the temporality of goals, Kubayi14 states that in the World Cup in Russia (2018) the majority of goals occurred in the opening and closing minutes of the second half, while Li & Zaho15 state that the majority of goals in the five major European leagues occur in the final 15 minutes of the match. This information partially coincides with what we have obtained, since the time frame in which most goals were scored was the first 15 minutes of the second half, with the first and last 15 minutes of the first half and the middle 15 minutes of the second half being the next step.
ConclussionsThe results of this study demonstrate the importance of working on certain defensive actions in goalkeeping situations in the daily life of goalkeepers. As one-handed deflections and blocks are the most repeated actions by GKs, they should be given the necessary attention in the sessions so that the goalkeepers can execute them correctly in the matches. It would also be necessary to provide variability in the direction of a shot already executed by means of obstacles to work on situations in which shots are deflected or bounce before reaching the goal. Another of the situations to which importance should be given is to generate actions in which the shot is finished in a single contact, since a large number of goals are scored in this way.
LimitationsEven taking into account the number of shots analyzed and the conclusions obtained, it is important to bear in mind the limitations of the study. All of the shots analyzed belong to a single league, the Spanish La Liga, so there may be differences in the rest of the professional leagues, both in Europe and other continents, when analyzing them.
Another aspect that has not been included in the study and may be of great importance in the competition is the weather, since phenomena such as rain, wind and sun can generate different responses in both the strikers and the goalkeepers.
Potential future researchContinuing with the study we present, the authors believe that analyses similar to this one with data from other important leagues in the world, such as the English Premier League, could be very interesting to learn about the differences between leagues in an objective manner.
In addition, we believe that the analysis of shots on goal should focus more on the play prior to the scoring chance, that is, to understand whether the shot comes from a set piece, a counterattack, a long pass, or a combined play.
The Authors declare that they don't have any conflict of interests.