


There is a general consensus in the literature regarding the existence of two ventilation break points during incremental exercise, i.e., Ventilatory Threshold 1 (VT1) and Ventilatory Threshold 2 (VT2), which mark the boundaries of the aerobic–anaerobic transition. The Inter-Threshold Area (ITA) has been defined as a parameter that connects the ventilatory thresholds. The main aim of the present study was to examine the ITA i.e., the expressed area between VT1 and VT2 for the function: ventilation÷oxygen uptake (VE/VO2 in L2min2) in individuals with various endurance capacities. Six hundred and six men with different levels of endurance completed an incremental exercise test and their ventilatory thresholds were recorded. The ITA is a trapezoid whose area is calculated as the sum of the area of the triangle and rectangle that form it between VT1 and VT2 below the VO2/VE function. The mean ITA for the function VO2–VE was greater in cyclists, as the main representatives for endurance athletes, than the mean corresponding to physical education students, who averaged a lower endurance level (120±34 vs. 86±40L2/min2). The results suggest that the determination of the ITA can reflect metabolic status throughout the aerobic–anaerobic transition during maximal incremental exercise tests.
Existe un consenso general de que hay dos puntos de ruptura de la ventilación durante el ejercicio incremental, el umbral ventilatorio 1 (VT1) y el umbral ventilatorio 2 (VT2), que marcan los límites de la transición aeróbica-anaeróbica. El área interumbral se ha definido como un parámetro que relaciona los umbrales ventilatorios. El objetivo principal del presente estudio fue examinar el área entre los umbrales (ITA), es decir, el área entre VT1 y VT2 para la función ventilación/absorción de oxigeno. Seiscientos seis varones con diferentes estados de condición física, desarrollaron una prueba de esfuerzo incremental y se registraron los umbrales ventilatorios. EL ITA es un trapecio cuya área se calcula como la suma del área del triángulo y rectángulo que lo forman, tal como se muestra en la figura entre VT1 y VT2 y que permanecen por debajo de la función VO2/VE. La media de ITA para la función VO2-VE fue mayor en los ciclistas, como representantes de deportistas de resistencia, frente al área correspondiente a los estudiantes de educación física con menores niveles de resistencia (120±34 vs. 86±40L2/min2). Estos resultados sugieren que la determinación del ITA puede reflejar adecuadamente el estado metabólico durante el proceso de transición aeróbico-anaeróbico durante las pruebas de esfuerzo incrementales.
The term ‘anaerobic threshold’ was initially coined by Wasserman and McIlroy (1964) using the respiratory exchange ratio (RER) to detect the beginning of anaerobic metabolism in patients with cardiac problems performing stress tests.1 Later, Wasserman, Whipp, Koyl and Beaver (1973), defined the anaerobic threshold as: (1) a non-linear increase in ventilation (VE), (2) a non-linear increase in the removal of CO2 (VCO2), (3) an increase in the partial pressure of O2 during a series of breaths (PetO2), with no corresponding drop in the partial pressure of CO2 (PetCO2), (4) an increase in the RER, positively correlating to work load (all during an incremental exercise test). In contrast, Skinner and McLellan (1980) developed the triphasic model which uses gaseous exchange (breathing) variables, thus distinguishing the two thresholds: the Ventilatory Threshold 1 (VT1) and the Ventilatory Threshold 2 (VT2). Unfortunately, in the literature, VT1 and VT2 are known by different names which has led to much ambiguity.2
It is assumed that VT1 and VT2 are influenced by changes in the concentration of lactic acid in the blood.3–5 Ideally, the ventilatory thresholds (VTs), which mark the boundaries of the aerobic–anaerobic transition, should be as close as possible to the maximum oxygen consumption value (VO2max). This is so the body may experience conditions where oxygen can be used efficiently for as long as possible. Acidosis begins when VT1 is surpassed, and at this stage compensatory hyperventilation facilitates the continuation of exercise as lactic acid builds up.
Several studies have provided descriptive data for VT1 and VT2 in different groups of athletes6–11; however, the literature appears to contain no reports referring to the relationship between these thresholds, nor does it suggest if there is an ideal relationship between the VTs. As suggested in a review article12 the VT1 can vary between 0.5% and 22% in relation to VO2max, while the variation of the VT2 ranges from 2.5% to 12.8%, and with specific reference to this review, these variations occur over one or more competitive seasons. Furthermore, a parameter known as the Inter-Threshold Area (ITA) has been said to connect the VTs.13 The ITA is expressed as the area between VT1 and VT2 for the function: ventilation/oxygen uptake (VE/VO2 in L2min2).
According to this rationale, the general aim of this study was to examine the ITA, and to report the values of inter-ventilatory threshold in a large sample of male athletes who specialize in different sports. The data was collected through subject completion of a maximal incremental exercise test until exhaustion. Our investigation followed a verified protocol proposed by Peinado et al. (2014). We hypothesized that athletes who participate in typical endurance-dominant sports, e.g., cycling and athletics (track), will display higher VT1 and VT2 values; as well as the ITA being a suitable variable to indicate metabolic status during a maximal incremental exercise test.
Material and methodsParticipants606 men completed a maximal incremental exercise test until exhaustion using a cycloergometer (Jaeger ER 800, Germany) or a treadmill (H/P/COSMOS 3PW 4.0, H/P/Cosmos Sports & Medical, Nussdorf-Traunstein, Germany): 251 cyclists, 104 triathletes, 53 swimmers, 51 track athletes, 17 basketball players, 26 football players, 12 gymnasts and 92 physical education (PE) students. All tests were performed under similar atmospheric conditions (temperature 22.8±0.6°C; relative humidity 62.5±4.4%; barometric pressure 703.54±7.41mmHg). All subjects were informed about the nature of the study and gave their signed consent for participation, in accordance with the norms set out by the Declaration of Helsinki regarding research involving human subjects.14 All mentioned procedures in the present research were approved by our Local Ethics Committee.
Instruments and parametersAll participants performed a maximal incremental exercise test to determine their maximal oxygen uptake (VO2max) and VTs. Verbal encouragement was provided to ensure that maximal effort was reached. Gas exchange data was continuously collected during each test using an automated breath-by-breath system (Jaeger Oxycon Pro gas analyser, Erich Jaeger, Viasys Healthcare, Germany). The volume signal and gas analysers were calibrated with a syringe of known precision and volume of analyzed gas mixture, respectively. The values were averaged for a 60s period. A 12-lead electrocardiogram (ECG; Viasys Healthcare, Germany) was continuously recording during the tests to determine the Heart Rate (HR). At least two of the following criteria were required for the attainment of VO2max: the plateau in VO2 values despite increasing workload, RER≥1.1, or the attainment of 95% of the maximum theoretical heart rate (HRmax).7,15 The VTs were determined according to the criteria proposed by Davis (1985) and Siegler, Gaskill and Ruby (2003), whilst VO2max obtained were determined according to Lucia et al. (2006), and were set in a specific manner in order to achieve the point of maximal agreement between the different methods of assessment. The results from all the tests were evaluated by two researchers in a double blind process. The coefficient of variation between the assessments of these two researchers and those of a highly-experienced expert was 1.3%.
The calculation for ITA as well as the correction (CITA) was performed according to the elementary model proposed by Peinado et al. (2014): the area under the curve (the ITA) for the functions VO2/VE (L2min2), load÷VO2 (WLmin2) and Load/VE (WLmin2). It is calculated as the sum of the area of the triangle and the rectangle below the function VE/load (see Fig. 1).13
Statistical analysis
Data were tested for normality, based on skewness (−2<z<2) and kurtosis (−2<z<2) using the Kolmogorov–Smirnov test. The Pearson's bivariate correlation analysis was performed to examine the relationship between performance variables, VO2 and the ITA. Differences between the results of the two subject groups were compared using the Independent Samples Student t Test. Effect sizes between the different methods of expressing the VTs were calculated using Cohen's d; using the means and the pooled standard deviations of the measurements from the conditions. Cohen's d was corrected for dependence among means by using the correlation between the two means. Interpretation of Cohen's d: an effect size of less than 0.33 is considered small, while 0.33–0.55 is considered moderate and effect sizes of 0.56–1.2 are considered large. Comparisons were two-tailed. All data were prepared and analyzed using SPSS v15.0® (SPSS Worldwide Headquarters, Chicago, IL) software. The significance level for all studies was set at p<0.05.
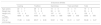
ResultsTable 1 shows the anthropometric variables and VO2max for the sample, divided into two categories, sports with a high endurance component and sport with a low endurance component. For endurance sports, VO2max values are relatively higher for cyclists (71.89±8.84mL/min/kg) compared to triathletes (65.37±8.39mL/min/kg), swimmers (53.91±7.54mL/min/kg) and track athletes (61.21±9.07mL/min/kg). In sports with a smaller endurance component, basketball players reported higher VO2max values (58.33±5.56mL/min/kg) than those obtained by soccer players (56.5±5.03mL/min/kg). PE students and gymnasts expressed the lowest VO2max values.
Anthropometric variables and VO2max for sportsmen with high and low endurance capacity.
| Endurance athletes | |||||
|---|---|---|---|---|---|
| Cycling | Triathlon | Swimming | Track and field | Total | |
| Age (years) | 22±7 | 28±6 | 15±4 | 31±11 | 19±6 |
| Weight (kg) | 68±7 | 70±8 | 58±16 | 71±9 | 53±8 |
| Height (cm) | 175±6 | 177±7 | 167±14 | 174±6 | 139±7 |
| VO2max (mL/min) | 4846±624 | 4558±692 | 3106±908 | 4280±558 | 3358±556 |
| VO2 rel (mL/min/kg) | 71.89±8.84 | 65.37±8.39 | 53.91±7.54 | 61.21±9.07 | 50.48±6.27 |
| Not endurance athletes | |||||
|---|---|---|---|---|---|
| Physical education students | Basketball | Football | Artistic gymnastics | Total | |
| Age (years) | 26±8 | 17±3 | 22±4 | 18±2 | 17±3 |
| Weight (kg) | 75±9 | 79±12 | 71±6 | 65±6 | 58±6 |
| Height (cm) | 177±5 | 187±9 | 177±5 | 168±7 | 142±5 |
| VO2max (mL/min) | 3983±621 | 4590±674 | 4016±410 | 3348±471 | 3187±435 |
| VO2 rel (mL/min/kg) | 53.42±7.91 | 58.33±5.56 | 56.5±5.03 | 52.03±6.59 | 44.06±5.02 |
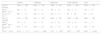
Table 2 show the values obtained from the VTs and ITA for the two groups according to the endurance component. In descending order, reported VT1 values are as follows: track athletes (65.0±8.6%), triathletes (58.6±9.3%), cyclists (56.0±7.5%), and swimmers (55.4±7.7%). The cyclists displayed the highest ITA values (35.75±17.11L2min2) in comparison to triathletes (31.10±15.86L2min2), track athletes (23.07±12.30L2min2) and swimmers (16.11±12.67L2min2). Athletics (track) (65.0±8.6%) and basketball (64.6±10.2%) displayed a higher aerobic threshold (%) in comparison to the other sports. With regards to the different sports and anaerobic threshold percentages, many differences were reported. In addition, basketball players and tracks athletes presented high average ITA values with respect to other sports (30.23±13.70L2min2, 23.07±11.06L2min2) (see Table 2).
Ventilatory thresholds and inter-ventilatory threshold area for sportsmen with high and low endurance capacity.
| Cyclists | Triathletes | Swimmers | Track and field | Total | |
|---|---|---|---|---|---|
| VO2 VT1 (mL/min) | 2749±535 | 2672±591 | 1692±474 | 2793±525 | 2476±531 |
| HR VT1 (beastmin−1) | 144±13 | 139±15 | 139±15 | 149±13 | 143±14 |
| VO2max VT1 (%) | 56.6±7.5 | 58.6±9.3 | 55.4±7.7 | 65±8.6 | 59±8.3 |
| VO2 VT2 (mL/min) | 4116±622 | 3914±616 | 2564±735 | 3808±526 | 3600±625 |
| HRVT2 (beastmin−1) | 177±11 | 170±12 | 175±12 | 176±10 | 174±11 |
| VO2max VT2 (%) | 84.9±6.0 | 86.0±6.4 | 83.1±7.2 | 89.1±6.4 | 85.8±6.5 |
| ITA (L2min2) | 35.75±17.11 | 31.10±15.86 | 16.11±12.67 | 23.07±12.30 | 26.51±14.48 |
| Physical education students | Basketball | Football | Artistic gymnastics | Total | |
|---|---|---|---|---|---|
| VO2 VT1 (mL/min) | 2188±530 | 2967±671 | 2254±514 | 1737±427 | 2287±536 |
| HR VT1 (beastmin−1) | 137±17 | 147±18 | 141±18 | 129±9 | 138±16 |
| VT1 VO2max (%) | 54.9±10.3 | 64±10.2 | 55.8±9.1 | 51.7±8.0 | 56.8±9.4 |
| VO2 VT2 (mL/min) | 3327±583 | 4117±654 | 3416±409 | 2686±517 | 3386±541 |
| HR VT2 (beastmin−1) | 171±12 | 176±15 | 174±12 | 165±12 | 171±13 |
| VT2 VO2max (%) | 83.6±6.8 | 89.8±6.4 | 85.1±6.0 | 79.9±6.0 | 84.6±6.3 |
| ITA (L2min2) | 25.39±14.64 | 30.23±13.70 | 26.91±11.85 | 17.47±10.65 | 25.00±12.71 |
Heart rate (HR), oxygen consumption (VO2). Subscripts max, VT1 and VT2 indicate maximum, first ventilatory threshold and second ventilatory threshold respectively. Inter-threshold area (ITA), i.e., the area defined between VT1 and VT2 for the function ventilation/oxygen uptake.
The values of the inter-ventilatory threshold area were significantly higher for subjects with a high endurance capacity, for both the absolute values (t300=3–88, p<0.001, d=0.37) and for the corrected (T298=4.31; p<0.001; d=0.41). Both the VT2 and VT1 (in percentages with respect to the VO2max) were significantly higher for subjects with a high resistance (t604=1.85; p=0.033, d=0.18) in comparison to those with a low resistance (t213=2.06, p=0.022, d=0.20). The absolute values of VT2 and VT1, too, were significantly higher for subjects with a high endurance in comparison to those with a low endurance (T198=7.37; p<0.001, d=0.70 and T604=6.07; p<0.001 d=0.58).
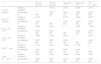
Although significant (p<0.001), the study of correlational analysis (Table 3) indicates a very low ITA, in relation to the values of VT1 and VT2 expressed in absolute (ml/min) or relative (%) values. Only the correlation between ITA and VT2 (ml/min) can be considered as strong and appropriate (r=0.601). Moderate effects were found for the inter-ventilatory threshold area (d=0.41) and very low values for the VTs (d=0.20), expressed in percentages with respect to VO2 max. Cohen's d value was higher for VTs in absolute values (ml/min VO2) (d=0.58).
Correlations for different parameters.
| VO2 VT1 (mL/min) | VO2 VT2 (mL/min) | VO2max VT1 (%) | VO2max VT2 (%) | ITA (L2min2) | ||
|---|---|---|---|---|---|---|
| VO2 VT1 (mL/min) | Pearson's correlation | 1 | 0.874** | 0.646** | 0.386** | 0.176** |
| Sig. (bilateral) | 0.000 | 0.000 | 0.000 | 0.000 | ||
| N | 606 | 606 | 606 | 606 | 606 | |
| VO2 VT2 (mL/min) | Pearson's correlation | 0.874** | 1 | 0.277** | 0.392** | 0.601** |
| Sig. (bilateral) | 0.000 | 0.000 | 0.000 | 0.000 | ||
| N | 606 | 606 | 606 | 606 | 606 | |
| VO2max VT1 (%) | Pearson's correlation | 0.646** | 0.277** | 1 | 0.606** | −0.363** |
| Sig. (bilateral) | 0.000 | 0.000 | 0.000 | 0.000 | ||
| N | 606 | 606 | 606 | 606 | 606 | |
| VO2max VT2 (%) | Pearson's correlation | 0.386** | 0.392** | 0.606** | 1 | 0.278** |
| Sig. (bilateral) | 0.000 | 0.000 | 0.000 | 0.000 | ||
| N | 606 | 606 | 606 | 606 | 606 | |
| ITA (L2min2) | Pearson's correlation | 0.176** | 0.601** | −0.363** | 0.278** | 1 |
| Sig. (bilateral) | 0.000 | 0.000 | 0.000 | 0.000 | ||
| N | 606 | 606 | 606 | 606 | 606 | |
| CITA (L2min2) | Pearson's correlation | 0.273** | 0.660** | −0.224** | 0.404** | 0.985** |
| Sig. (bilateral) | 0.000 | 0.000 | 0.000 | 0.000 | 0.000 | |
| N | 606 | 606 | 606 | 606 | 606 | |
ITA, inter-threshold area.
CITA, correct inter-threshold area.
The aim of this study was to examine the ITA and, to report the values of inter-ventilatory threshold in a large sample of male athletes who specialize in different sports. We propose that the aerobic–anaerobic transition should be examined through the calculation of the ITA, between VT1 and VT2. To our knowledge, this is the first study to provide evidence of a relationship between the VTs in a large sample of healthy individuals with different levels of physical fitness, specifically referring to endurance capacity.
The inter-ventilatory threshold areaIdeally, the VTs, which mark the boundaries of the aerobic–anaerobic transition, should be as close as possible to the VO2max; as such so that the body may experience conditions where oxygen can be used efficiently for as long as possible. During acidosis, which begins when VT1 is surpassed, compensatory hyperventilation facilitates the continuation of exercise as lactic acid builds up. Therefore, it is plausible to argue that a higher ITA is the result of a greater capacity to undertake endurance tests, and illustrates that the subject is able to compensate for the increase in the lactic acid. Thus, a strong correlation exists between lactate and VTs.3–5,16 Once the VT2 is surpassed, the plasma lactic acid concentration increases markedly. This is the result of increased lactic acid production and a decreased rate of clearance. As a result, our research demonstrates that the highest ITA values are found in cyclists and triathletes; sports where high endurance capacity is vital for high-level performance. However, one cannot simply explain the high value of ITA reported in basketball players, as basketball is not considered as endurance dominant.17
The highest ITA values were obtained for cycling, followed by triathlon and basketball. Athletics (track) and basketball reported the highest aerobic threshold values (%) in relation to VO2max, above all other sports (see Fig. 2). There is a significant difference between the results of the anaerobic threshold (%) and the peak oxygen consumption between sports.
The ventilatory thresholds (% in respect to VO2max)
Mean values for cyclists’ aerobic threshold, expressed in percentages, were 56.6±7.5%. Our results are similar to those reported by Zapico et al. (2007): November–December (50±2.4%), January–February (61±2.1%) and May–June (56±2%). However, they are well below the values by Pardo (2001): November–December (76.1±1.3%) January–February (72±1.5%) and May–June (73.1±1.3%); who analyzed the evolution of aerobic–anaerobic transition throughout a competitive season. Our results also differ from those found by Withers et al. (1981) (66.3%), and Simon et al. (1986) (65.8%). The differences may be due to variations in the terminology and methodology used to determine the aerobic–anaerobic transition.2 The relationships between the ITA for the function VO2/VE and the VT2 (associated with present ergospirometric variables) are explained by the fact that a higher VT2 results in a larger ITA. The positions of VT1 and VT2 in the cyclists, in the present investigation, are similar to those reported in other studies.9,11,18–20 Overall, the ITA of the cyclists was higher in comparison to the other sports with lower endurance characteristics.
In our research, the mean values for the triathletes’ aerobic and anaerobic thresholds, expressed in percentages, were 58.6±9.3% and 86.0±6.4%, respectively. Galy et al. (2003) investigated the evolution of the physiological parameters over seasonal parameters, and found an aerobic threshold rate ranging from 73.8±0.2% and 75.6±0.2%; and for the anaerobic threshold of 79±0.2% and 88.9±0.2. It is plausible to assume that the differences in reported aerobic threshold values, between the investigations, are a result of the method used to determine the aerobic–anaerobic transition. We discovered that the method used was the same as ours.21 Other studies22–25 reported large variations in VTs (ranging between 61% and 81%). Again, the differences and variability can be explained by nomenclature used in terms of aerobic–anaerobic transition,2 the methods for determining the thresholds21 and the mode of exercise.26
For swimming, soccer, gymnastics, athletics (track), and PE, the percentages of the aerobic threshold, with respect to VO2max, were very similar (ranged between 51.7% and 55.8%), but lower than endurance-specific sports. Therefore, the higher values obtained for this parameter in the aerobic–anaerobic transition are for athletics (track) (65.0±8.6%) and basketball (64.6±10.2%). The mean percentage of the anaerobic threshold is very similar for all sports (ranging from 80% to 89%). Our results are in accordance with those reported by Bunc et al. (1987) where a total of 223 highly trained track athletes were studied. In particular, the anaerobic threshold percentage values ranged between 80.5% and 86.6%.6 Track athletes and basketball players have the highest aerobic threshold percentage values with respect to the VO2max, above all other sports. Between sports, there is a significant difference in reported anaerobic threshold percentages from the peak oxygen consumption.
Expression of the ventilatory thresholdsIn this study, we assessed the degree of association between VTs in the two categories of track athletes studied. We believe that the manner one expresses the VTs can result in significantly different outputs. The calculation of the ITA aims to aid and explain the high values commonly found in endurance track athletes. One would expect that track athletes with a greater endurance component (in both training and competition) would report significantly high relative values. However, no significant differences between groups with a high and low endurance component were reported for both VT1 (59±8.3% versus 56.8±9.4%), and VT2 (85.5±6.5% versus 84.6±6.3%).
In this study, individuals with a low endurance capacity displayed an average VT1 value of 55.94±10.3 and VT2 value of 84.26±6.9, respectively; while individuals with a high endurance capacity had values of 57.88±8.5 and 85.4±6.4, respectively. When the effect size is calculated, the average athlete with a high endurance capacity would approximately exceed 58% (d=0.20; 57.8%) of the sample of athletes with a low endurance capacity. Therefore, it is not convenient to express VTs as a percentage of VO2max. However, the effect size for inter-ventilatory threshold area and VTs expressed in absolute values (ml/min) are appropriate ways to express the aerobic–anaerobic transition.
The effect size for absolute values of VT1 and VT2 of athletes with low endurance, 2253±606.26 for (VT1) and 3381.76±641.87 (VT2), means that approximately 71% could have higher values than the corresponding population of athletes with low endurance [2614.50±635.09 and 3856.91±787.02 for VT1 and VT2, respectively) (d=0.50, 69.1%)]. The effect size for the inter-ventilatory threshold area is less (d=0.40, 65.5%) than VT1 and VT2 in absolute values. We believe it is appropriate to express the VTs first as absolute values, and secondly as values in terms of inter-ventilatory threshold area, but never as percentages of VO2max.
When the obtained effect size is estimated over 58% (d=0.20; 57.8%) of the athlete population with a low endurance capacity, VT1 and VT2 values will differ from the average athlete sample with high endurance. Therefore, it is not convenient to express the VTs as percentages of VO2max. However, the effect size of the ITA and VTs expressed in absolute values (ml/min) are appropriate ways to express the aerobic–anaerobic transition. Approximately 66% of the population with low endurance would be higher than the corresponding area of high endurance (d=0.40; 65.5%); whilst almost 71% of the ventilatory threshold (ml/min) would be higher in endurance track athletes. Therefore, it seems appropriate to express the VTs first as absolute values, and secondly as values in terms of inter-ventilatory threshold area.
ConclusionThe ITA is a simple method to assess the relationship between the VTs. The ITA allows one to distinguish between athletes with different endurance capacities. Moreover, it is inconvenient to express the anaerobic thresholds as percentages with respect to VO2max, as it is routinely done. It is more appropriate to report thresholds as absolute values of oxygen consumption. In relation to expressing the VTs, the results of this study indicate that the ITA does not present superior information in comparison to absolute values of VT1 and VT2.
Conflict of interestsAuthors declare that they don’t have any conflict of interests.

