


The aim of the study was to compare the muscle mass obtained by anthropometry and bioelectrical impedance, in athletes competing by weight categories. 109 (42 women y 67 men), age 21.4 ± 3.5 years, boxing (32), weightlifting (16), judo (28), karate (12), fighting (14) and taekwondo (7) practitioners were selected. The protocol included nineteen anthropometrics variables and a bioelectrical impedance analysis (akern®), estimating the muscle mass by anthropometry by the Lee's equation (2000) and by bioimpedance by Janssen's equation (2000), calculating the muscle mass index (IMM, kg/m2). In ten athletes it was examined whether in a second exploration the changes over time were similar by both techniques. The intraclass correlation coefficient (ICC) and the Bland-Altman analysis were applied to assess the concordance. Results: The IMM estimated by Lee vs Janssen, was in the female sample, 9.01 ± 1.01 kg/m2 vs 8.68 ± 1.1 kg/m2; and in the male sample, 11.17 ± 1.34 kg/m2 vs 11.04 ± 1.13 kg/m2 .The ICC was 0.945 [95%IC; 0.915-0.964]. The difference in the IMM between both techniques was 0.21; with a confidence range of 95% between +1.60 a -1.18. In the longitudinal study, five of the athletes controlled (50%), gave differences in the assessment of their IMM's changes. We concluded that even though in a statistical sense there is a high concordance between both equations being valid for epidemiological studies, the differences found cannot be assumed as interchangeable for the individual assessment of each athlete nor in comparative studies.
The determination of muscle mass is of particular interest in the sports population. The most reliable methods are imaging techniques, CT (computed tomography) and MRI (magnetic resonance imaging), which are considered the reference techniques1. However, these are very costly and not free of risk, as in the case of CT due to its high level of radiation. The continuous monitoring required by athletes makes it necessary to have an easy to apply method; among these, the most widely used are anthropometry and bioimpedance, known as field techniques because they can be performed outside laboratories.
In the case of athletes competing in weight categories, their body composition must be the most favourable, with the optimal proportion of fat and muscle mass. And possible fluctuations in body weight throughout the season should maintain muscle mass, as the opposite would lead to a loss of the strength and power required for best performance. Generally, the minimum body weight at which athletes can compete is estimated on the basis of lean weight (fat-free weight) they have at the time of the study, to which the weight corresponding to the theoretical minimum fat percentage is added.2 As muscle mass is the main constituent of lean weight, it remains undetermined within these calculations and is therefore not individually assessed or controlled.
Anthropometry (A) and bioimpedance (BIA) are also referred to as doubly indirect techniques for body composition analysis because they are validated from indirect methods such as dual X-ray absorptiometry (DEXA), plestimography, MRI or CT3.For estimating muscle mass in adults the anthropometric equation developed by Lee et al.4 and the BIA equation proposed by Janseen et al.5 are utilised, both using MRI as reference technique.
There are numerous studies in the literature that compare the anthropometric and bioimpedance techniques in different types of samples, but from the point of view of the study of body fat and/or comparing them with other reference techniques.6–10 However, there are few studies that compare both techniques in the estimation of muscle mass, most of these being in the general population, with the aim of assessing the presence of sarcopenia.11–14In endurance athletes, Knechtle et al. 15compared both the fat and muscle component using BIA and anthropometry and found significant differences between the two techniques.
The aim of the study was to estimate muscle mass using the equations developed by Lee (anthropometry) and Janssen (bioimpedance) in athletes competing in different weight categories in different sports in order to check the degree of agreement between the two equations, including a longitudinal study.
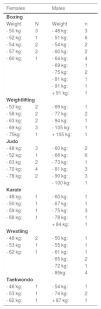
Material and methodSampleA total of 109 athletes (42 females and 67 males), mean age 21.4±3.5 years, practising boxing (32), weightlifting (16), judo (28), karate (12), wrestling (14) and taekwondo (7), were selected for the study. Their distribution by weight category is shown in Table 1. Of the sample, four were African (one judo and three boxers) and the rest were Caucasian. All competed at international and/or national level, with 9.7±4.9 years of sport practice, training 5.5±0.7 days/week and 3.3±0.9 hours/day. A first cross-sectional analysis was performed on the entire sample, control 1 (C1), and a second longitudinal analysis, control 2 (C2), on 10 athletes from the first control. For inclusion in the study, the athletes had to be over 18 years of age, with no change in height (≤0.5 cm) and a time elapsed between C1 and C2 was not less than 6 months or more than half a year. All athletes signed an informed consent form prior to the study.
Distribution by weight categories.
The protocol included: weight (kg), height (cm), eight skinfolds (iliac crest, supraspinal, abdominal, biceps, triceps, subscapular, front thigh and medial calf, in mm) and nine body circumferences (shoulder, chest, waist, hips, arm relaxed,arm contracted, forearm, middle thigh and maximum calf, in cm). The technique was carried out in accordance with the recommendations of the ISAK (International Society for the Advancement of Kinanthropometry),16 except for the variable of middle thigh. 17 The material used was: weight scale (Seca 665)accuracy of 0.1 kg, stadiometer (Holtain) accuracy of 0.1 cm, skinfold caliper (Holtain) accuracy of 0.2 mm, anthropometric tape (Rosscraft)accuracy of 0.1 cm.Subcutaneous fat was estimated by the sum of 8 skinfolds, total fat by the equation of Withers et al (1987)18,19 and muscle mass by the equation of Lee et al (2000)4, in absolute values and in relation to the square of height (muscle mass index, IMMA). Muscular cross-sectional areas (CSA)20 were also calculated at the arm, thigh and calf levels.
Equation of Lee et al..4: Muscle mass (kg) = Height x (0.00744 x CAC2 + 0.00088 x CTC2 + 0.00441 x CCC2) + 2.4 x sex - 0.048 x age + race + 7.8
Sex = 0 for female and 1 for male, race = −2.0 for Asian, 1.1 for African American, and 0 for white and Hispanic.
CAC (skinfold-corrected arm circumference):arm circumference –π* triceps skinfold
CTC (skinfold-corrected thighcircumference): thigh circumference –π* front thigh skinfold
CCC (skinfold-corrected calfcircumference): calf circumference –π* medial calf skinfold
Height in meters, circumferences and skinfolds en centimeters.
Bioimpedance analysisThe bioimpedance analysis (BIA) was performed in the early morning on an empty stomach together with the measurement of body height and weight. The analyser was the BIA 101 Anniversary model (Akern SRL). The athlete lay supine on a non-conductive stretcher, arms not touching the body and legs at an angle of about 45º. After cleaning the skin with alcohol, the four electrodes (BIA-TRODESTM, Akern SRL) were placed on the right side, two on the dorsal surface of the metacarpophalangeal and metatarsophalangeal joints of the third finger and toe respectively, and the other two medially to the bi-styloid prominences of the wrist and bi-malleolar prominences of the ankle. Any metallic items worn by the subject were removed. A minimum of two analyses were performed, repeating when there were differences between them, until two similar ones were obtained. The following data were obtained: resistance (R, Ω), reactance (X, Ω), phase angle (Ph A), total body water (TBW), extracellular water (ECW), intracellular water (ICW), extracellular/intracellular ratio (ECW/ICW). Muscle mass was estimated by the equation of Janssen et al.5, in absolute values and in relation to the square of the height (muscle mass index, IMMBIA).
Equation of Janssen et al.5: Muscle mass (kg) = [(Height2/R x 0. 401) + (sex x 3.825) +
(age x -0. 071)] + 5.102
Height in centimeters; R, Resistance in ohmios; sex = 0 for female and 1 for male; and age in years.
Statistical analysisDescriptive statistical treatment of the variables was carried out. The Shapiro-Wilk normality test showed that 18 of the variables did not follow a normal distribution, opting for non-parametric tests for the comparative study between sexes and between controls, the Mann-Whitney U test for independent samples and the Wilcoxon test for related samples respectively. The correlation between both indices was obtained by Spearman's Rho. The degree of agreement between techniques was determined using the intraclass correlation coefficient (ICC) and the Bland-Altman analysis. SPSS (version 19) and Excel programs were used, with
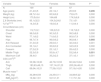
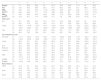
ResultsCross-sectional studyTables 2 and 3 show the anthropometric and BIA data respectively for the total sample and by sex. Significant differences were found in all variables between the male and female samples, with the exception of age, hip and thigh circumferences, and in the difference obtained between the muscle mass indices estimated by each technique (IMMA-IMMBIA). This difference was 0.34±0.59 kg/m2 in females and 0.13±0.77 kg/m2 in males (p = 0.066). Males were taller and heavier, with lower percentage of fat and sum of skinfolds, higher muscle cross-sectional area (CSA) and muscle indices. In BIA, females had higher values for endurance and reactance; and lower total body water percentage. In fluid distribution, they obtained a higher percentage of extracellular water and a lower percentage of intracellular water.
Anthropometric characteristics (mean ± SD).
| Variable | Total | Females | Males | P* |
|---|---|---|---|---|
| N | 109 | 42 | 67 | |
| Age (years) | 21,4±3,5 | 22,1±4,1 | 20,9±3 | 0,206 |
| Weight (kg) | 68,7±14,4 | 60,9±9,2 | 73,6±15 | 0,000 |
| Height (cm) | 170,5±9,4 | 164±68 | 174,5±8,6 | 0,000 |
| ∑ 8 Skinfolds (mm) | 85,1±32,5 | 104,3±24,8 | 73,1±31 | 0,000 |
| % Fat18,19 | 14,3±5,8 | 19,6±3,4 | 11,0±4.4 | 0,000 |
| Circumferences (cm) | ||||
| Shoulder | 112,7±9,1 | 106,2±5,9 | 116,7±8,3 | 0,000 |
| Chest | 96,0±8,9 | 90,3±5,5 | 99,5±8,8 | 0,000 |
| Waist | 77,1±8,2 | 71,6±5,3 | 80,6±7,9 | 0,000 |
| Hips | 96,7±7,4 | 96,6±6,2 | 96,8±8,1 | 0,968 |
| Arm Relaxed | 31,3±3,9 | 29,6±3,1 | 32,3±4,0 | 0,001 |
| Arm Contracted | 33,1±4,1 | 30,8±3,2 | 34,5±3,9 | 0,000 |
| Forearm | 27,2±2,9 | 25,1±2,1 | 28,4±2,5 | 0,000 |
| Middle Thigh | 52,3±5,9 | 50,8±,4,7 | 53,2±6,4 | 0,051 |
| Maximum Calf | 36,4±3 | 35,2±2,3 | 37,1±3,1 | 0,001 |
| CSA (cm2)20 | ||||
| Arm | 53,56±16,90 | 42,73±10,55 | 60,34±16,64 | 0,000 |
| Thigh | 183,63±46,15 | 157,14±31,23 | 200,24±46,41 | 0,000 |
| Calf | 89,64±16,51 | 77,59±10,81 | 97,19±14,95 | 0,000 |
| Muscle mass 4 | ||||
| MMA (kg) | 30,29±6,59 | 24.25±3.11 | 34,08±5.22 | 0,000 |
| IMMA(kg/m2) | 10,34±1,61 | 9,01±1,01 | 11,17±1,34 | 0,000 |
Bioimpedance analysis (mean ± SD).
| Variable | Total | females | males | p* |
|---|---|---|---|---|
| n | 109 | 42 | 67 | |
| Resistance (Ω) | 507,3±82,3 | 557,7±68,9 | 475,8±63,9 | 0,000 |
| Reactance (Ω) | 61,8±8,3 | 63,5±8,7 | 60,7±8,0 | 0,043 |
| Phase angle | 7,1±0,8 | 6,58±0,73 | 7,3±0,8 | 0,000 |
| Total body water (%) | 59,2±4,6 | 56,6±3,4 | 61,1 ±4,3 | 0,000 |
| Extracelular water (%) | 41,7±3,2 | 43,5±3,1 | 40,5 ±2,8 | 0,000 |
| Intracellular watter (%) | 58,3±3,2 | 56,5±3,1 | 59,5±2,9 | 0,000 |
| Ratio extra/intra | 0,72±0,10 | 0,77±0,10 | 0,69±0,08 | 0,000 |
| Muscle mass 5 | ||||
| MMBIA (kg) | 29,70±6,57 | 23,4±3.4 | 33,68±4,64 | 0,000 |
| IMMBIA(kg/m2) | 10,13±1,61 | 8,68±1,10 | 11,04±1,13 | 0,000 |
Muscle mass estimated by the Janssen equation5. MMBIA, Muscle mass by bioimpedance. IMMBIA, Muscle mass index by bioimpedance.
The minimum value for each IMMA vs IMMBIA equation was 7.04 kg/m2 vs 6.97 kg/m2; and the maximum value was 13.89 kg/m2 vs 14.31 kg/m2, with a range of 6.85 kg/m2 vs 7.34 kg/m2 and a variation coefficient of 15.62 % vs 15.88 %. The interquartile range Q1- Q3 of the indices was 9.19-11.10 kg/m2 and 8.89- 11.37 kg/m2 respectively in the total sample. The median (50th percentile), IMMA was 10.42 kg/m2 and IMMBIA was 10.25 kg/m2.
The Rho Spearman correlation (Fig. 1) between the muscle mass indices estimated by each technique was 0.902 (p<0.01), indicating a strong positive linear correlation between the variables. The ICC between both techniques was 0.945 [95%IC; 0.915 – 0.964]. In Fig. 2, the match according to Bland-Aldman is represented, showing in a scatter diagram the mean IMM value obtained by each estimation equation ((IMMA+IMMBIA)/2) on the X-axis, and the differences between both (IMMA –IMMBIA), on the Y-axis.
: on the Y axis, IMMA anthropometric technique and on the X axis, IMMBIA, bioimpedance.")
 X axis, represents mean MMI (kg) between the two anthropometric and bioimpedance equations. Y axis, shows difference between IMM obtained by each equation. The representation of the limits of agreement (Lines in blue), from -1.96 SD to +1.96 SD.")
Bland-Aldman analysis between IMM (Muscle Mass Indexes)
X axis, represents mean MMI (kg) between the two anthropometric and bioimpedance equations. Y axis, shows difference between IMM obtained by each equation. The representation of the limits of agreement (Lines in blue), from -1.96 SD to +1.96 SD.
The mean muscle mass index between the two equations, (IMMA+IMMBIA)/2) was 10.23±1.57 kg/m2, with a minimum of 7.14 kg/m2, a maximum of 13.97 kg/m2, median of 10.43 kg/m2 and interquartile range of 9.14 kg/m2 -11.26 kg/m2. The mean of the differences between the two techniques in the MMI was + 0.21 ± 0.71 kg/m2; with a 95% confidence range of +1.60 to -1.18 kg/m2. This mean value ± 1.96 SD is shown in the graph. No distribution bias according to MMI range was observed, although more clustering was observed in the central values. The mean is close to zero and is positive, indicating that the IMMA tends to be higher than the IMMBIA. We can also observe that the values that lie outside the confidence range are at the top, indicating higher values for anthropometry.
Longitudinal studyNo statistical differences were found between the C1 and C2 control variables for related samples, except for hip circumference (p = 0.034). The mean IMMA in C1 (IMMAC1) was 9.72 ± 1.53 kg/m2 and in C2 (IMMAC2) 9.69 ± 1.46 kg/m2. While the IMMBIA of C1 (IMMBIAC1) was 9.47 ± 1.39kg/m2 and in C2 (IMMBIAC2) kg/m2 9.33 ± 1.37kg/m2.
Table 4 shows the data of the 10 athletes assessed at C1 and C2. In five a difference was observed in the change detected in IMM (IMMAC1 - IMMAC2 vs IMMBIAC1 - IMMBIAC2) ≥ 2% between the two techniques:
Most representative variables of the 10 athletes included in the longitudinal study.
C1, first control. C2, second control. IMMA, muscle mass index by anthropometric technique; IMMBIA, by bioimpedance. CSA, cross-sectional muscle areas. ∑ 8 PL. C., sum of 8 skinfolds. TBW, Total body water. ICW, Intracellular water. ECW, Extracellular water.
Subject #8, male karate competitor in -75 kg, gains 1.6 kg (+2.2%) body weight, minimally decreases the sum of 8 skinfolds (11.1%) and increases arm and thigh CSA. The contracted arm and forearm circumference also increases. Total water decreases by 1.3 l (-3.1%) at the expense of the extra-cellular water (ECW). In relation to the IMM, the anthropometric technique shows an increase of 0.29 kg/m2(+3.1%) and the BIA shows a decrease of 0.49 kg/m2(-5.1%).
Subject #7, female karate competitor in -50 kg, gains 2.4 kg (+5.1%) body weight, slightly increases the sum of 8 skinfolds (12.8%) and the thigh CSA. Increase in hip circumference and contracted arm circumference. Total and compartmental water are maintained in absolute values (litres). In relation to the IMM, the anthropometric technique shows an increase of 0.27 kg/ m2(+3.2%) and BIA shows a decrease of 0.16 kg/ m2(-1.9%).
Subject #4, male boxer competing in -49 kg, gains 1.3kg (+2.5%) body weight, slightly increases the sum of 8 skinfolds (12.3%) and minimally decreases the CSA of the arm and thigh. Increase in hip circumference. Total water increases by 0.6 l at the expense of the ECW. In relation to the IMM, the anthropometric technique shows a decrease of 0.30 kg/m2(-2.7%) and the BIA in unchanged (+0.7%).
Subject #2, a female boxer competing in -57/54 kg, maintains body weight, the sum of 8 skinfolds and CSA/perimeters (with a diminishing trend). Fluids also show minimal changes, gaining 0.5 l of ECW and losing 0.3 l of intra-cellular water (ICW). In relation to the IMM, by the anthropometric technique it decreases by 0.20 kg/m2(-2.2%) and by the BIA it is maintained at 0.05 kg/m2(+0.6%).
Subject #9, male karate competitor at + 84 kg; in C2 he refers 45 days of inactivity due to injury.He maintained his body weight, increased the sum of 8 skinfolds (18%), increased the CSA of the arm and decreased the CSA of the thigh. In perimeters, the hip and contracted arm increase. In fluids, the subject loses 0.8 l of the ECW. In relation to the IMM, the anthropometric technique shows a difference of 0.07 kg/m2(+0.7%) and the BIA shows - 0.14 kg/m2 (-1.3%).
On the other hand, considering the athletes who have had the greatest changes in their body weight, in both the evolution of the MMI has the same tendency (increase or decrease), with a percentage difference of 0.9 between the indices.
Subject #5, male boxer who competed at -52 kg in C1 and moved to -56 kg in C2, gained 3.7 kg (+6.4%) of body weight, maintaining the sum of 8 skinfolds and increasing CSA of the arm and thigh. Increase in shoulder, contracted arm, forearm and hip perimeters. The ICW increases by 1.6 l. In relation to the IMM, by both techniques it increases, 0.34kg/m2(+3.5%) vs 0.26 kg/m2(+2.6%), anthropometry and BIA respectively.
Subject #3, female boxer in the 60 kg category, loses 3.6 kg (-5.8%) of body weight at C2, after being inactive for 75 days due to a shoulder injury that required surgery. She maintains the sum of 8 skinfolds and markedly decreases the CSA of the upper arm, contracted arm and forearm perimeters. In fluids, he loses 1.7 l of the intracellular compartment. IMM decreases with both techniques, 0.56 kg/m2(-6.7%) vs. 0.61 kg/m2(-7.6%), anthropometry and BIA respectively.
DiscussionMagnetic resonance imaging (RM) is considered the gold standard technique for the determination of muscle mass1 and has the advantage that it does not irradiate the subject. However, it is expensive and requires a specialised facility. Regression equations have been developed to estimate muscle mass based on this technique as a reference, relating it to anthropometric variables such as the Lee equation4 and to the electrical resistance value obtained by bioimpedance such as the Janssen equation.5 The present study compares the results obtained by both equations in a large sample of athletes competing in weight categories in which weight fluctuations are frequent and in which it is relevant to determine the muscle component, as these are disciplines that require muscle strength and power.
The intraclass correlation coefficient (ICC) of 0.945 [95%IC; 0.915 – 0.964] is in the very high range indicating excellent agreement between the two techniques. Among the objections attributed to this parameter is that the ICC assumes a similar measurement error in the two methods and that its value depends on the variability between subjects, since the higher the variability, the higher the correlation obtained.21 In our case, the prediction error of the muscle mass of each equation is 2.2 kg vs 2.7 kg; with an R2 of 0.91 vs 086; for Lee4 and Janssen5 respectively. Therefore, the anthropometric equation of Lee4 is more accurate. On the other hand, the variability of our sample is very wide as the subjects are athletes from different weight categories from lower to higher. The variability of each index is similar, according to the coefficient of variation (15.6 vs. 15.9 %), although with a greater range in the IMMBIA, as both the maximum and minimum values are more extreme.
In the Bland-Altman analysis, a bias of + 0.21 was obtained with a confidence range of 95% between +1.60 and -1.18. The graph shows no changes in the differences depending on whether the estimated muscle mass is higher or lower. We can also see that 4 cases clearly are outside the established range of 95%, highlighting one, whose difference between muscle indices is 2.73 kg/m2. This was a male karate player, with the IMM being higher due to the anthropometric technique.
The acceptable difference between methods is a decision for the evaluator and does not depend on statistical parameters, but rather on the objective of the study21 and the repercussions that these variations may have when applied to the individual assessment and not to samples as a whole. In the case of top-level competitive athletes, small changes in their body composition can be significant and have repercussions on their physical performance, with muscle mass being the component involved in the development of strength and power. Therefore, it is important to muscle mass, more so when a certain weight has to be given in order to be able to compete in the assigned category.
The IMM data of other authors are in relation to the cut-off points for the diagnosis of sarcopenia. Using the BIA technique with the Janssen equation5, similar analysers and Caucasian population, Masanés et al. (2012)22 set it for men at 8.31 kg/m2 and for women at 6.68 kg/m2; Tichet et al. (2008)23 for men: 8.6 kg/m2 and for women: 6.2 kg/m2, establishing them as two SDs below the mean for healthy young people, the former for Spaniards and the latter for French. The mean of the Spaniards22 was 9.65±0.70 kg/m2 and 7.65±0.49 kg/m2, age 28.6±5 and 28.2±6 years, males and females respectively. A lower index than that obtained in this study and more homogeneous, due to its lower SD. This is to be expected since our sample is made up of sportsmen and women having greater muscle mass development as well as being younger. On the other hand, Janssen et al. (2004)24 fixed the following values as moderate and severe sarcopenia in men: 8.51-10.75 kg/m2 and ≤ 8.50 kg/m2 and in women: 5.7-6.75 kg/m2 and ≤5.75 kg/m2, in the US population, over 60 years of age in relation to the degree of disability detected. In our sample the minimum value in men is 8.39 kg/m2 of a mini-flyweight taekwondo athlete (-55 kg), in the severe sarcopenia range and 28 athletes (16 boxing, 4 wrestling, 4 karate, 2 judo and 2 taekwondo) are in the moderate range; while no woman is in the sarcopenia range, the lowest value being 6.97 kg/m2 in two taekwondo athletes of mini-flyweight (- 46 kg) and karate (- 48 kg).
The IMMA estimated with the Lee equation4 by Canda (2019)25 in a sample of judo athletes was 11.5±1.0 kg/m2 in males (n = 187) and 9.3±0.7 kg/m2 in females (n = 131). This study is more heterogeneous, with judo in addition to other sports modalities, with less muscular development, so the mean is slightly lower and the SD higher. In relation to cut-off points for sarcopenia by this same equation, Canda (2015)26 set it as the 2.5 percentile of a sample of 883 male and 506 female top-level competiton athletes, between 20 and 39 years of age, 9.1 kg/m2 and 7.3 kg/m2, respectively for men and women. In this study, two male taekwondo athletes (- 55 kg and - 63 kg) and one female karate athlete (- 59 kg) were found to be in the sarcopenic range.
The finding of athletes with MMI values in the sarcopenia range could be due to the fact that the equations underestimate or are less reliable in athletes, mainly in those with low body weight. On the other hand, it should be borne in mind that the definition of sarcopenia also entails a decrease in strength and that the loss of muscle mass associated with ageing is accompanied by qualitative changes in fibre type, architecture, aerobic capacity, intermuscular adipose tissue infiltration (IMAT), fibrosis and neuromuscular activation.27–29
The longitudinal study of the 10 athletes does not reflect statistically significant differences as a whole, but if we evaluate the IMM behaviour of each athlete individually we can see that in 50% the differences in the changes detected between techniques are equal to or greater than 2%. In two subjects their assessment would have been completely opposite, i.e. the MMI increases for one and decreases for the other, depending on which technique was used in their estimation. In three other subjects, while the MMI remains the same for one technique, it increases or decreases for the other. If we take into account the rest of the variables included in the protocol, it seems that they are more in favour of the evolution detected by the anthropometric equation than by the BIA equation.
The two proposed equations for estimating muscle mass take into account the age, sex and height of the subject for their calculation. Lee's equation4 includes the race variable (caucasian, black and asian), while Janssen's equation5 was developed for Caucasians and its application was subsequently validated with African-Americans and Hispanics, but found to underestimate with Asians.
The results obtained for body composition using the BIA-based equation have the disadvantage of being influenced by changes in body fluids and therefore require the subject to be in a state of euhydration.30 In the case of athletes competing in weight categories, there can be significant fluctuations in the intracellular and extracellular water compartments, as well as in total water since in pre-competitive periods rapid losses in body weight are usually at the expense of the water component. There are other studies of body composition with BIA that validate it with DEXA, but this technique cannot be considered as gold standard due to estimates and inaccuracies in the calculation of muscle mass.13,31–33 However, its application is widespread, as is BIA, in detriment of anthropometry. BIA measures the conductivity of the body to the passage of an electric current. The human body is considered as a homogeneous cylindrical conductor, whose volume is equal to its length, which corresponds to the size of the subject, times the area (A). In turn, the resistance (R) of a conductor is proportional to its length (size) and inversely proportional to the area. Therefore, substituting in the equation we obtain that the index T2/R (impedance index) would represent the volume of the conductor, in this case the fat-free mass. A constant hydration of 73 % is also assumed for this component.
The authors of this study consider that the anthropometric technique carried out by experienced personnel and always following the same standardisation is a useful tool for monitoring changes in muscle mass in athletes, with the Lee equation4 being the most appropriate until the development of a specific equation for the athlete population. In addition, the rest of the anthropometric variables provide more data for an overall assessment of body composition, making it possible to better discern possible changes. There are two other anthropometric equations for estimating muscle mass based on anatomical models, which are derived from the Brussels Cadaver study34, comprising only 12 male subjects of advanced age (71.7±8.5 years), proposed by Martin (1990)35 and Doupe (1997)36, which lack cross-validation and do not take into account variations by age, sex and race. Said equations do not seem appropriate for the study population, i.e., the highly competitive athlete, male or female, of a much lower age range and with a totally different degree of physical activity and body composition. The assumptions of this technique include that the skinfold represents the subcutaneous adipose tissue that surrounds in a uniform ring shape the cross-section area of the muscle segment, considered as a circle, and that the different muscle groups are proportional to the total muscle mass. Recently, Al-Gindan et al. (2014)37 developed estimation equations with anthropometric and demographic variables with MRI as a reference, without including skinfolds, in a sample of 423 subjects, age 18-81 years, with a lower coefficient of determination and a higher muscle mass error estimation than Lee.4
BIA is a supplementary technique in the study of body composition and could be an alternative to anthropometry in subjects whose obesity would make skinfold measurement difficult or less reliable as it directly estimates lean and/or muscle tissue. However, when BMI is higher than 34 kg/m2 it has been found to overestimate fat-free mass due to changes in hydration and trunk size.38,39 In women, possible changes in body fluids are influenced by the phase of the menstrual cycle. Therefore, it must be ensured that all requirements for its application are met and that the subject is in a normal state of hydration.30,40
Bioimpedance also studies hydration and nutritional status by means of the impedance vector obtained with the direct values of resistance (R) and reactance (X), known as bioimpedance vector (BIVA). The length of the vector indicates hydration, while its direction, dependent on the phase angle, is related to cell mass. The vector is represented on a graph whose axes are R and X normalised by height, where we have reference values in the form of ellipses covering 50%, 75% and 95% tolerance in a normal healthy population.41,42 A new avenue of research, as indicated by Castizo-Olier et al.43, could be to generate new tolerance ellipses specific to each sport, sex, age and race, determining the changes in hydration that affect health and performance and the target zones of impedance vectors for athletes.
This study adds a longitudinal study to the cross-sectional study of a large sample of sports modalities characterised by competing in weight categories which, although small in size, has allowed us to verify the differences in the assessment of muscle indices according to the estimation technique used.
We believe that new muscle mass prediction equations are needed with MRI as the reference technique and in relation to the anthropometric technique and the BIA, which are specific, i.e., developed with a representative sample of the population of athletes, male and female, with the appropriate age range, and which include the different sports modalities. In the case of the anthropometric technique, a greater number of variables can be incorporated such as trunk body perimeters as well as limb perimeters since, depending on the specific biomechanics of each sport, different muscle groups are involved. And in the case of BIA, the reactance and phase angle variables can also be associated with anthropometric parameters.
We conclude that even though the muscle mass estimated by the Lee and Janssen equations derived from the anthropometric and bioimpedance techniques respectively have a high degree of concordance, which is valid for epidemiological research, they are not interchangeable and important errors could be made in the individual assessment of subjects and in comparative studies.

