El objetivo del trabajo fue determinar en los deportistas con IMC en rango de obesidad la relación entre índices de adiposidad y grasa corporal estimada por antropometría y establecer cuáles serían los más válidos para esta población.
Se realizó un estudio retrospectivo de los deportistas con IMC igual o mayor de 30 kg/ m2. La muestra fue de 173 deportistas (151 varones y 22 mujeres), edad de 23,3 ± 4,9 años, con 9,8 ± 5 años en competición y un entrenamiento de 16,6 ± 7,1 h/semana. El protocolo incluyó 15 variables y se calcularon los índices antropométricos relacionados con la adiposidad y la grasa corporal. Mediante las curvas ROC, se comprobó el grado de exactitud diagnóstica en relación con la obesidad (porcentaje de grasa elevado).
Las variables antropométricas con mayor área bajo la curva fueron los pliegues cutá- neos, y de estos el supraespinal (IC 95%: 0,889-0974) con un punto de corte de 21 mm, seguidos del perímetro de abdomen en relación con la talla (IC 95%: 0,784-0,916) con un punto de corte de 0,57. De los deportistas, el 72% hubieran sido mal catalogados de obesidad por su IMC, estableciéndose que hasta un IMC de 32,8 kg/m2 en varones puede considerarse como sobrepeso debido predominantemente a su componente magro o libre de grasa.
Para diagnosticar la obesidad en los deportistas, la grasa corporal debe ser estimada mediante la toma de los pliegues cutáneos o, en su defecto, mediante la medición de la circunferencia de cintura en relación con la talla.
The aim of this paper is to examine athletes whose BMI is in the obesity range, and to determine the relationship between their adiposity indices and their body fat measured by anthropometry, while establishing which would be the most valid for this population.
A retrospective study was carried out on athletes with a BMI of 30 kg/m2 or higher. The sample consisted of 173 athletes (151 males and 22 females), aged 23.3 ± 4.9 years, with 9.8 ± 5 years in competition, training 16.6 ± 7.1 hours/week. The protocol included 15 variables and the calculation of anthropometric indices related to adiposity and body fat. ROC curves were used to check the level of diagnostic accuracy in relation to obesity (high fat percentage).
The anthropometric variables with the greatest area under the curve were skinfolds and, in particular, supraspinale skinfolds (95% CI: 0.899-0.974), with a cut-off point of 21 mm. These were followed by waist circumference to height ratio (95% CI: 0.784-0.916) with a cut-off point of 0.57. As many as 72% of the athletes would have been wrongly classified as obese by their BMI. It was established that a BMI of up to 32.8 kg/m2 may be considered as overweight for males, mainly due to their lean or fat-free mass.
In order to diagnose obesity in athletes, body fat should be assessed by means of skin-fold measurements or, failing that, by measuring waist circumference to height ratios.
Introduction
Body mass index (BMI), body weight divided by height squared, is an anthropometric index that is widely used in the diagnosis of obesity. It is one of the criteria for estimating cardiovascular risk. The value above which an individual is considered obese is 30 kg/m2. While this index is very valid for the general population, doubts arise in athletes because it includes total body weight, i.e., the sum of the fat component and the lean component; we remember that obesity is defined as an abnormal or excessive accumulation of fat that may harm health.1 Someone who does sport will undergo more or less hypertrophy of the skeletal muscles, basically depending on how they train and their level of training,2,3 which may or may not be accompanied by a loss of body fat. An athlete may therefore have a high BMI without having a dangerous excess of body fat, or their BMI may be overestimated if the classical classification is applied.
Other anthropometric indexes apart from BMI have been defined to improve the diagnosis of obesity. These include the conicity index,4 the body shape index5 and body perimeter measurements of the waist, hips and thigh, or the ratio between them or with height. They are used to estimate fat and its central or peripheral location.6 Different cut-off points have been set according to their association with cardiovascular and overall mortality in longitudinal studies.7,8 An additional problem is the different standardisation of some measurements, such as waist perimeter, which may be measured at different levels of the abdomen.9
Anthropometrics estimates body fat by using regression equations created on the basis of skinfolds, deriving from the relationship between subcutaneous fat and visceral fat. Withers et al.10,11 developed a specific equation for athletes, taking hydrostatic weighing as its benchmark. The problem arises when there is a great excess of subcutaneous fat, as it may be difficult or technically impossible to measure skinfolds.
The aim of this work is to determine the relationship between adiposity indexes and the amount of body fat estimated by anthropometrics in athletes with a BMI in the obesity range, establishing which indexes would be the most valid for this type of population.
Material and methods
A retrospective observational study was undertaken of the athletes who visited our centre from 1993 to 2015, selecting those who fulfilled the following criteria: a BMI equal to or greater than 30 kg/m2, above 16 years of age and Caucasian. Ten athletes were then excluded from the sample, as it was not possible to measure the total profile of their skinfolds (5 women and 5 men). The sample was therefore composed of 173 athletes (151 men and 22 women), with an average age of 23.3 ± 4.9 years old, who had been competing for 9.8 ± 5 years and who trained for 16.6 ± 7.1 hrs per week. The sports they practiced were classified as team sports (A): basketball (n = 3), handball (n = 5), rugby (n = 33) and water polo (n = 2); sports in which competition is divided into weight categories (B): weight lifting (n = 21), judo (n = 43), karate (n = 1), wrestling (n = 16) and taekwondo (n = 1); throwing sports in athletics (C): hammer (n = 11), shot-put (n = 11), discus (n = 3); and technical sports (D): fencing (n = 2), golf (n = 2), archery (n = 1), target shooting (n = 17) and sailing, Finn (n = 1).
The following anthropometric protocol variables were included: weight, height, sitting height and 5 body perimeters: the neck (measured immediately above the thyroid cartilage larynx prominence), abdominal 1 (measured at the natural waist), abdominal 2 (measured at the umbilical level), the hips (at the maximum circumference around the buttocks) and the thigh (at the point midway between the groin fold and the upper edge of the patella); and 7 skin-folds: triceps, subscapula, biceps, abdominal, supraspinal, the anterior thigh and medial leg. Weight and height are measured at the start of the morning before eating, without shoes and with minimum clothing. Skinfolds were taken 3 times, giving the average value of the measurements that were outside the range of technical error in measurement. The anthropometric material used as well as the technique followed the recommendations of the International Society for the Advancement of Kinanthropometry (ISAK),12 except for the measurement of thigh and abdominal 2 perimeter.13
The following anthropometric indexes were calculated: abdominal 1/height (C1/T), abdominal 2/height (C2/T), abdominal 1/sitting height (C1/TS), abdominal 2/sitting height (C2/TS), abdominal 1/hips (C1/C), abdominal 2/hips (C2/C), abdominal 1/thigh (C1/M), abdominal 2/thigh (C2/M), body mass index (BMI: weight, kg/height m2), SHBMI (weight, kg/sitting height m2), weighted index (WI: weight1/3, kg/height, cm * 100), conicity index (CI: abdominal 1 (m)/0.109 * √(weight, kg * height, m)2, body shape index (BSI: abdominal 1 m/BMI2/3 * height1/2 m)3. Body density (BD) was estimated using Withers8,9 equations and then by Siri’s formula, 1962 ([4.95/DC] − 4.5) * 100) giving the percentage of fat. BD: women: 1.17484-0.07229 * (log [triceps + subscapula + supraspinal + medial leg], in mm); men: 1.0988-0.0004 * (triceps + biceps + subscapular + supraspinal + abdominal + anterior thigh + me-dial leg, in mm). Calculating fat weight and lean weight, in absolute values and as a ratio with height squared. A categorical variable was defined according to percentage of fat, classifying it as in the high risk range (the presence of obesity) when it was over the 97th percentile set in the population of athletes,2 which corresponds in men to 22% and 29% in women; the others are considered to in the low risk range (the absence of obesity).
Statistical descriptions of the results were prepared, for the total sample and according to sex and sports group. The Student t test and ANOVA (post hoc by Bonferroni) were used to detect possible differences between them, taking the uniformity of variances into account (Levene’s test), while variables with a distribution that did not fulfil the normality criteria (Kolmogorow-Smirnov) were subjected to the Mann-Witney U test and the Kruskal-Wallis test. Pearson’s chi-squared test was used to analyse the different proportions of the groups established according to their risk group. ROC curves were then used to determine exactitude (sensitivity [S] and specificity [E]) by using the area under the curve (ABC) of the different variables and indexes with the range of risk assigned according to body fat. This study was only performed for the sample of men, as the sample of women was small (n = 22). According to Swets,14 a low level of exactitude is considered to stand at from 0.5-0.7; a useful level of exactitude is from 0.7-0.9; and a high level of exactitude is > 0.9 ABC. Scores with an ABC in the range of usefulness and a 95% CI, were considered when calculating the cut-off point using Youden’s J point (the maximum value obtained of the sum of sensitivity plus specificity minus one).15 The value for statistical significance was above P < .05. Version 19 of the IBM SPSS program was used for statistical analysis.
Results
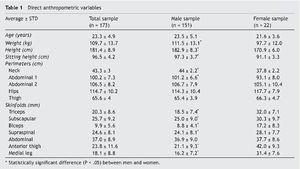
The general anthropometric characteristics of the total sample of 173 athletes are shown according to sex in Table 1. Significant differences were found between the male and female samples, as the men had higher values except for age, abdominal perimeter 2, hips and thigh, while they were similar for the abdominal skinfold. The greatest differences in the skinfold profiles arose in the skinfolds of the limbs.
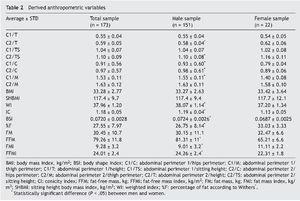
The adiposity scores and body weight components are shown in Table 2. Statistically significant differences were found between men and women in: C2/T, C2/TS, C1/C, C2/C, C1/M, WI, IC and BSI, as the men had lower scores in the first two indexes and higher scores than the women in the others. In body composition the men had significantly more fat-free mass in absolute values and also relative to height (FFMI) as well as a lower percentage of body fat relative to total weight and relative to height (FMI) than the women.
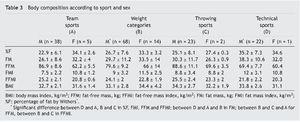
Table 3 shows the body composition scores according to type of sport and sex.
Except for BMI, there are statistically significant differences in the sample of men between those who do different sports. While those who do technical sports have a higher percentage of fat and fat index (kg/m2) that differs significantly from those who do the other sports (P < .0001), while in absolute terms (kg) the difference arose in those who do team sports (P < .0001) and weight categories (P < .007). The smallest lean component in absolute terms and as a ratio of height occurs in those who do technical sports, with significant differences from the other groups (P < .0001). They are followed by sports governed by weight categories, which also differed in absolute terms from those who do throwing sports and team sports (P < .001) and in connection with height with those who do throwing sports (P < .034). The comparison could not be made post hoc in the sample of women due to the small number of athletes who do each type of sport. The group who do throwing sports had the smallest fat component and the largest lean component, in absolute as well as in relative terms.
When the athletes are grouped according to risk (percentile of fat percentage), 48 (27.7%) were found to be at high risk and 125 (72.3%) are at low risk. Significant differences were found (χ2 = 4.375, P = .036) and the percentage of high risk was higher in the women (90.9%) as opposed to the men (69.5%). Significant differences also emerged according to type of sport (χ2 = 14.14, P = .003), in team sports 58.1%; in sports with weight categories 74.4%; in throwing sports 64%; and in technical sports 100% of the athletes were in the high risk range.
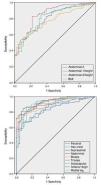
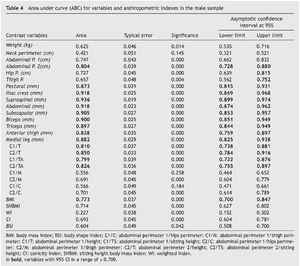
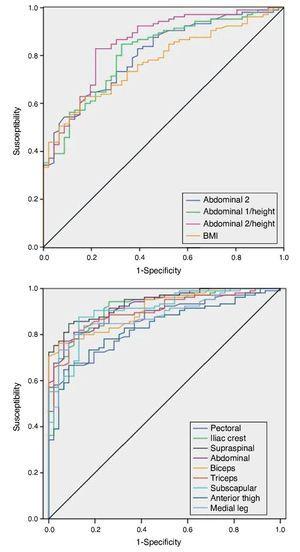
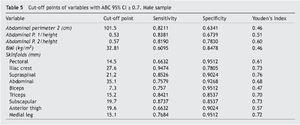
Table 4 shows the ABC and confidence interval of the ROC curves, in which the dichotomous state variable, the presence or absence of obesity (percentage of fat ≥ percentile 97) this was compared with the direct anthropometric variables and anthropometric scores. The variables which discriminate the most are printed in bold type. As was pointed out in material and methods, this was only undertaken in the sample of men as the sample of women was small. The variables with a 95% confidence interval with their lower limit at a figure of ≥ 0.7 and therefore of greater diagnostic usefulness were: the skinfolds, abdominal perimeter 2, abdominal indexes 1 and 2 in comparison with standing or sitting height and the BMI. Figure 1 shows the ROC curves, while Table 5 shows the cut-off points of the variables with the greatest exactitude to determine the existence of obesity in men, showing sensitivity, specificity and Youden’s index.
Figure 1. ROC curves. Upper graph: anthropometric perimeters and indexes. Lower graph: skinfolds.
Discussion
Athletes are differentiated by their bodily composition, due to their increased muscle development, although this depends on the type of sport they practice. It is more common to find a fat percentage in the range of obesity in sports-women than it is in sportsmen with a high BMI. In technical sports bodily composition does not significantly affect performance, so it is more common to find obese sportsmen and women, followed by athletes who compete in the highest weight categories, as they achieve a higher body mass not only at the expense of fat-free mass but also the fat component. While a BMI in the obesity range is more frequent in throwing sport athletes or those who compete in team sports, this is due to their increased lean component or fat-free mass. In our study approximately 72% of the athletes would have been incorrectly classified by the BMI, as their percentage of fat was in the normal range. The same BMI (33 kg/m2) corresponds to an average percentage of fat of 26.7% in men and 33% in women. The BMI therefore does not discriminate according to bodily composition, so it is necessary in athletes to differentiate between the fat and lean components.
ROC curve analysis in the sample of men indicates, as may have been expected, that skinfolds are the most closely correlated with the presence of obesity. Of the folds on the trunk the one with the greatest discriminatory power is the supraspinal fold (85.3% correct diagnosis of high risk of obesity, and 90.2% correct diagnosis of low risk of obesity), followed by the subscapular fold (87.4% high risk and 85.4% low risk). Of the limb skinfolds, the adipose panniculus located on the triceps classifies individuals with a high degree of exactitude (84.2% high risk and 85.4% low risk), followed by the fold in the medial leg (76.8% high risk and 95.1% low risk). Men have more subcutaneous fat on the trunk than they do on their limbs (android distribution), and when there is an excess of adipose panniculus fat is initially deposited at this level. The folds measured at an abdominal level are the largest, and therefore they are also harder to measure if the abdomen is rounded. When there is a major excess of body fat, the skinfolds become larger in general. The triceps skinfold is very accessible and determining this will be able to indicate whether or not there is obesity.
Of the abdominal perimeters, the one measured at umbilical (C2) level was a better diagnostic criterion than the one measured at the natural waist (C1) (95% CI: 0.728-0.880 vs. 95% CI: 0.662-0.832); both measurements increased in precision when they were associated with height (95% CI: 0.784-0.916 vs 95% CI: 0.738-0.881). It should be emphasised that differences only exist between the sexes in terms of body perimeter at the level of the abdomen in C1 (not C2) and neck perimeter, while the indexes show greater dysmorphism with the same BMI. The lack of agreement on standardisation of abdominal perimeter is a problem when using cut-off points, as these may differ from one location to another. This also has to be taken into account for other indexes such as conicity and body shape, as well as in the equations that include them to estimate body fat. Following the recommendations of the National Institute of Health (NIH),16 the Spanish Society for the Study of Obesity (SEEDO) recommends measuring this at the upper part of the iliac crest, as this bone reference point is more stable, setting the cut-off point for increased cardiovascular risk at > 102 cm and > 88 cm, for men and women, respectively. Nevertheless, this point is hard to locate, and more so if the individual is obese, as this is one of the places where the most adipose panniculus accumulates. The problem with measuring at umbilical level arises when there is so much excess fat that a flap forms which tends to descend due to gravity. Such cases of extreme obesity are rare in athletes. The ISAK12 sets the waist perimeter at the level of the natural waist, known as C1, and it is better to evaluate this in association with the subject’s height. The cut-off point for the perimeter measured at umbilical level is > 101.5 cm in our sample of men, which is similar to the one set for the general population by the SEEDO. Our data also indicate that this variable is independent of the BMI values obtained, as other authors17 have pointed out. In connection with cardiovascular risk, Mason and Katzmarzyk18 calculated the cut-off point at 100 cm for any abdominal level, except for the minimum waist which they set at 97 cm, although with different S and E depending on the location. Differences may also exist between ethnic groups.19 As we stated above, the relationship of the abdominal perimeter with the height of the subject increases the ABC of ROC curves, so that the cut-off point is set for men at 0.53 and 0.57, C1/T and C2/T respectively. Although these are more sensitive than BMI they are less specific, with a higher Youden index (C2/T: 0.60 vs. BMI: 0.46). For the general population the cut-off point set is somewhat lower at 0.50, and there is now general awareness of the message that you should “keep your waist circumference at less than half your height”.20
Hip perimeter had a higher ABC than when it was calculated in association with abdominal perimeter (C1/C, C2/C) and was greater than thigh perimeter and neck perimeter, in a range of low diagnostic utility. The ratio between waist and hip perimeter is defined to categorise central obesity, which is indicated by a value higher than 0.90 and 0.85, in men and women, respectively.21 This has now fallen into disuse because better associations with morbidity and mortality are obtained when the abdominal zone is evaluated absolutely. Nor do thigh perimeter indexes increase precision in association with the BMI for the presence of obesity.
In connection with the anthropometric indexes where only general variables of weight and height apply, BMI and WI, one squared and the other cubed, only the BMI is within the range of diagnostic utility (95% CI: 0.700-0.847), placing the cut-off point in the sample of men at 32.8 kg/m2, i.e., almost 3 kg per square metre more than in the general population. The new conicity and body shape indexes, which also include the perimeter of the abdomen, do not improve exactitude as obesity predictors and are even inferior to the BMI. They are therefore not useful variables for discriminating the existence of obesity, as least in the population of athletes.
Different proportions of trunk and leg length may affect the cut-off point selected, given that the greater part of body fat is located in the trunk. Due to this, for Asian individuals different BMI intervals have been set to classify its different degrees.22 In our work the exactitude of the indexes calculated with sitting height instead of using standing height did not increase diagnostic capacity.
In connection with the reference values for the Spanish population of athletes,2 the cut-off points are located in percentile 99 for the BMI, in percentile 95 for the triceps and anterior thigh, in percentile 97 for the biceps, and for all the other folds between percentiles 97-99. Respecting references to the general Spanish population of similar age and sex, the triceps is at percentile 85 and the subscapular one in percentiles 95.23 And in relation with the American population, our cut-off point would be located in percentile 85 and in percentile 90, for the triceps and subscapular, respectively.24
A large sample of women is necessary to be able to study the ROC curves, checking the validity of the anthropometric indexes and setting the cut-off points. It may be more feasible to repeat this study and selecting women with a BMI indicating overweight (> 25 kg/m2), as in comparison with men at the same BMI the women have a smaller lean component in absolute as well as relative terms, so that their cut-off point should be lower. More precise studies of body composition are also necessary, such as magnetic resonance imaging and computed tomography, for better quantification of the lean and fatty components in the population of athletes, together with their relationship with classic anthropometric variables.
Those individuals who regularly practice sport or physical exercise and who have a BMI indicating obesity, above all if the sport is not purely technical, should not be classified as such without first using complementary measures to estimate their body fat. Anthropometry is an easy and economical technique which allows us to measure skinfolds and use them to estimate the lean and fatty components. For individuals who are overweight skinfolds should only be measured where this is technically feasible, complementing the study by measuring abdominal perimeter in comparison with their height. It is advisable to use the cut-off points set specifically for their ethnic group. In athletes even a BMI of 32.8 kg/m2 may be considered to indicate overweight, due mainly to their fat-free or lean component.
Conflict of interests
The author has no conflict of interests to declare.
Acknowledgements
I would like to thank the athletes who came for sports medical check-ups, the doctors with grants who have worked during these years in the department, and my colleague Susana Higueras for her help in everyday work.
Received 9 August 2016;
accepted 12 September 2016
e-mail address: alicia.canda@aepsad.gob.es


